 ACCESS
Research Article
ACCESS
Research Article
Volume 1, Article ID: 2025.0004

Odivan Zanella
odivan.zanella@sertao.ifrs.edu.br


Denise Bilibio
denise.bilibio@sertao.ifrs.edu.br


Wagner Luiz Priamo
wagner.priamo@erechim.ifrs.edu.br

1 Department of Food Technology, Instituto Federal de Educação, Ciência e Tecnologia do Rio Grande do Sul–Campus Sertão, Sertão 99170-000, RS, Brazil
2 Department of Food Engineering, Instituto Federal de Educação, Ciência e Tecnologia do Rio Grande do Sul–Campus Erechim, Erechim 99713-028, RS, Brazil
* Author to whom correspondence should be addressed
Received: 24 Jan 2025 Accepted: 07 Jul 2025 Available Online: 07 Jul 2025 Published: 04 Aug 2025
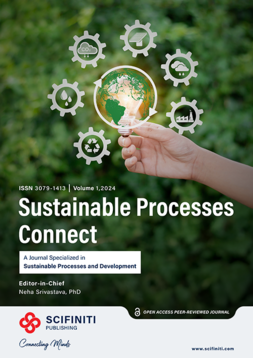
This study investigated the production and characterization of activated carbons (ACs) derived from grape stalks using CO2 and HNO3 as activating agents. Thermogravimetric analysis (TG-DTG) revealed three distinct stages of thermal decomposition, with mass losses attributed to water removal and the pyrolysis of hemicellulose, cellulose, and lignin. The AC yield varied depending on the activating agent, temperature, and number of cycles, with CO2 leading to lower yields but greater micropore development. Textural characterization revealed that HNO3-activated samples exhibited S(BET) specific surface areas of up to 741 m2/g, along with a higher proportion of mesopores compared to CO2-activated samples. FTIR analysis identified similar oxygenated functional groups across activation methods, with varying intensities. The point of zero charge (pHPZC) analysis indicated an acidic surface for HNO3 activated carbons (pHPZC between 5.2 and 5.5) and a basic surface for CO2 activated carbons (pHPZC ≈ 7.6). SEM images revealed that the fibrous structure of the grape stalks was preserved after activation, with the development of internal channels and macropores. This fibrous morphology gives the material added versatility, allowing it to be shaped into forms such as tows, fabrics, or felts, which is advantageous for a wide range of industrial and environmental applications.
Activated carbons (ACs) are widely recognized as highly effective adsorbents for removing a wide range of organic and inorganic pollutants from aqueous solutions [1]. Their applications range from medicinal uses to the storage of polluting gases, odor removal, gas separation, and catalysis. This material exhibits remarkable versatility, characterized by its large surface area, extensive pore volume, robust chemical stability, and the presence of various oxygen-containing functional groups on its surface [2,3]. The material may be derived from carbonaceous precursors that occur either synthetically or naturally. The economics of the process typically favor the selection of readily available and low-cost raw materials. Despite this, commercially available activated carbons are often costly, motivating the search for cheaper alternatives. To mitigate production costs, researchers worldwide are increasingly interested in using renewable and more affordable precursors for activated carbon preparation. Biomass-derived precursors offer a more economical source as they are abundant, renewable, have low mineral content, appreciable hardness, and are cost-effective. The literature extensively documents the use of agricultural by-products, particularly those of lignocellulosic origin. Examples of widely studied precursors include coconut shells, almond shells, peach pits, apricot pits, plum pits, cherry pits, and various nutshells, such as hazelnuts and pecans [4,5,6,7,8,9,10,11,12]. The composition of lignocellulosic biomass precursors plays a crucial role in determining the microporous structure of the resulting activated carbon (AC). Researchers have confirmed that lignin serves as the primary source of pure carbon, while cellulose and hemicellulose represent the volatile fractions of biomass [13]. Reed and Williams [14] studied five biomass samples with significantly different contents of cellulose, hemicellulose, and lignin. They observed that the thermal decomposition temperatures under an N2 atmosphere ranged from 325–400 °C for cellulose, 250–350 °C for hemicellulose, and 200–720 °C for lignin. They concluded that samples with higher lignin content yielded greater amounts of carbon and, consequently, more AC. In another study by Daud and Ali [15], the activation of palm tree bark and coconut shell was compared. The activation rate for coconut shell-based carbon was found to be higher than that of palm bark-based carbon due to the lignin content of the coconut shell. A subsequent study by Daud and colleagues [16] investigated the effect of carbonization temperature on palm bark. The authors reported that increasing the carbonization temperature from 500 °C to 900 °C gradually reduced the yield of pure carbon from 33% to 24%. This reduction was attributed to the release of carbon, hydrogen, and oxygen, resulting from the rearrangement of the carbon structure into aromatic rings. They also concluded that the micropore volume increased as the carbonization temperature rose. Grape stalks, a byproduct of the wine industry, pose significant challenges for disposal. Due to their high moisture content, they exhibit low heat capacity and remain in the soil for extended periods before decomposing completely. Grape stalks consist of the main stalk and pedicels (shorter branches) and primarily function to support and supply nutrients to grapes. Therefore, this study explored the production of activated carbon (AC) from grape stalks using three different activation processes. The goal was to produce AC with a large surface area, well-developed porosity, and heterogeneous surface chemistry, particularly regarding surface functional groups.
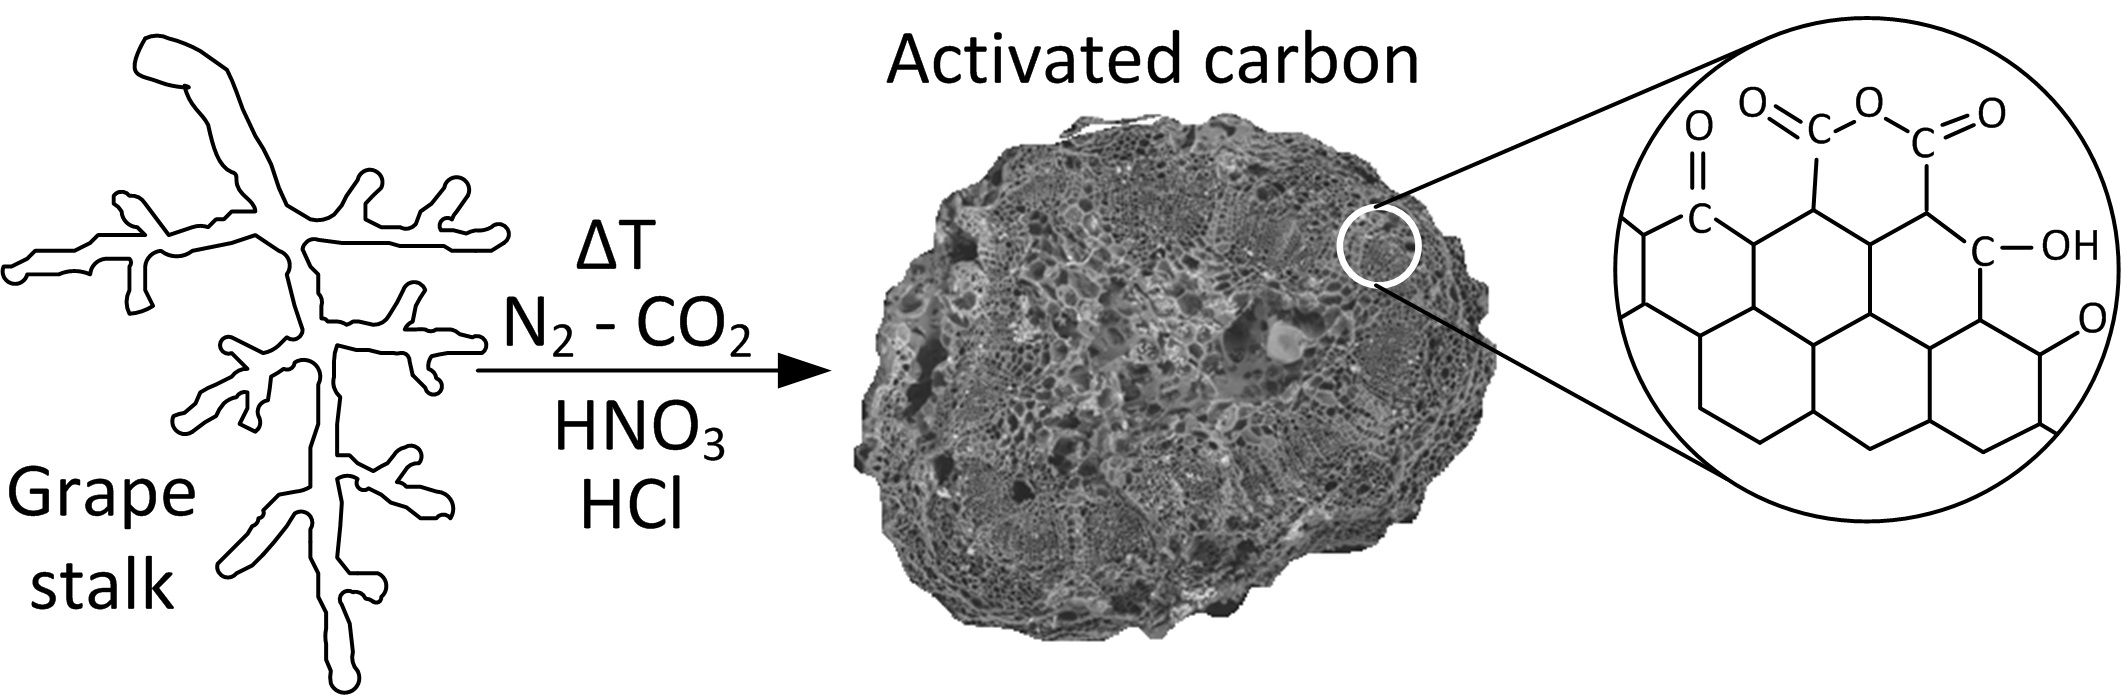
2.1. Preparation The grape stalks used as a precursor for carbon production were obtained from a wine and grape juice industry located in the state of Rio Grande do Sul, Brazil. These grape stalks were separated after the grapewere extracted and were not treated with any chemical additives. A sample of grape stalks (1 kg) was thoroughly washed with distilled water over several cycles until the washing water was clear, without turbidity or visible residues. The washed grape stalks were then dried in an oven at 105 °C ± 5 °C for 24 h. Once dried, the material was crushed and sieved to obtain a standardized particle size. The processed grape stalks were stored at room temperature until further use. For charcoal preparation, the particle size fraction selected was between 0.3 mm and 1.0 mm. 2.2. Pyrolysis and Activation of the Charcoal During the carbonization step (pyrolysis), 50 g of grape stalks were placed in a quartz reactor (45 cm length, 2.0 cm inner diameter). The reactor was positioned in a muffle furnace capable of reaching 1600 °C (Figure 1). The precursor material was carbonized at a final temperature of 400 °C, with a heating rate of 10 °C/min, and held at this temperature for 1 h under a constant nitrogen (N2, 99.0%) flow of 100 cm3/min. After the carbonization process, the reactor was allowed to cool to room temperature under continuous N2 flow. The resulting carbon was then stored at room temperature until the activation step [1]. Physical activation of the carbon was performed by heating at 10 °C/min in a 99.0% CO2 atmosphere, with a constant flow of 100 cm³/min, at varying temperatures and durations. This step aimed to obtain activated carbons (ACs) with varying characteristics to allow for process optimization. After activation, the samples were cooled to room temperature under CO2 flow, then washed with 0.5 L of distilled water for 24 h. The chemical activation process involved oxidation using different agents. First, oxidation with 33% HNO3 was performed by boiling under reflux for 20 min. Oxidation with 1 M HCl was carried out at 20 °C for 24 h with stirring. After each oxidation treatment, the following steps were performed: the samples were washed with distilled water until neutrality was reached, then dried in a muffle furnace at 105 °C. The heat treatment was applied after each oxidation step at 700 °C for 90 min, using a nitrogen flow rate of 100 cm3/min and a heating rate of 10 °C/min. These conditions were established based on previous experiments conducted by the research group [1]. After each activation cycle, the reactor was cooled under nitrogen flow, and the AC was collected, washed with 0.5 L of distilled water for 24 h, and dried in a muffle furnace at 105 °C. Finally, the yield and textural properties were determined before initiating a new cycle. The activated carbons were labeled according to the activating agent, temperature, time, and the number of application cycles. For example, the label CO2/500/60/1 indicates that the activation process was conducted with CO2 at 500 °C for 60 min, and one activation cycle was completed. The production yield of AC was determined based on the initial mass of the precursor and the final mass of AC (on a dried basis) using the following equation: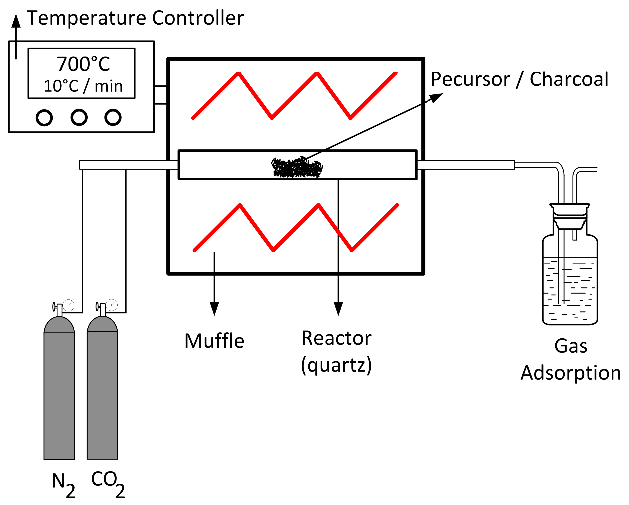 where wi represents the initial sample weight in grams before carbonization and wf represents the weight in grams of the sample at the end of the activation process.
2.3. Characterization of the Samples
2.3.1. Precursor
Thermogravimetric (TG) and Derivative Thermogravimetry (DTG) analyses were performed using a thermobalance (TA Instruments Q600 STD). These analyses were primarily conducted to identify the temperature values at which the grape stalks undergo reactions in an inert atmosphere. The samples were analyzed in a platinum crucible containing 20 mg of it. The heating rate was set to 10 °C/min, starting at 25 °C and increasing to 900 °C in a nitrogen atmosphere (99.9%) with a constant flow rate of 30 mL/min. The structural properties of the grape stalk samples were determined according to standard methods found in the literature (lignin, cellulose, and hemicellulose content) [17,18]. The ash mass fraction of the raw material was determined by calcination at 800 °C in a crucible for 2 h.
2.3.2. Activated Carbons (ACs)
The surface areas of the activated carbons (ACs) were determined from N2 adsorption isotherms conducted in a volumetric apparatus (Micrometrics Tristar II 3020). The adsorbents were degassed at 300 °C for 12 h before the adsorption experiments. The S BET (Brunauer, Emmett, and Teller) specific surface area was calculated by applying the BET equation to the N2 adsorption data at 77 K [1,19]. The pore size distribution for mesopores and micropores was determined using the Barrett-Joyner-Halenda and Horvath-Kawazoe methods [20,21]. The total pore volume was evaluated from the amount adsorbed at a relative pressure of approximately 0.99. The elemental composition of the samples (C, N, H, and S) was analyzed using a PerkinElmer 2400 apparatus.
Fourier transform infrared spectroscopy (FTIR) was used to qualitatively assess the chemical structure of the carbon materials. The IR spectra were obtained over a frequency range of 500 to 4000 cm−1 using a Varian 640 FTIR spectrometer. The activated carbon samples were ground to a fine powder and mixed with KBr at a weight ratio of 700:1. Approximately 200 mg of the mixture was used to prepare KBr pellets.
The types and amounts of surface functional groups present in the AC samples were determined using Boehm titration [22]. Carboxylic, lactonic, and phenolic groups were quantified by neutralizing them with basic solutions of different base strengths, such as NaHCO3, Na2CO3, NaOH, and C2H5ONa. The content of basic groups was determined by titration with HCl. The point of zero charge (pHPZC—defined as the pH at which the surface of the sorbent has a neutral charge) was determined using the methodology proposed by Herczynska (the “11-point experiment”) [23]. The morphology of the AC samples was evaluated by Scanning Electron Microscopy (SEM) using a Hitachi TM3000 apparatus.
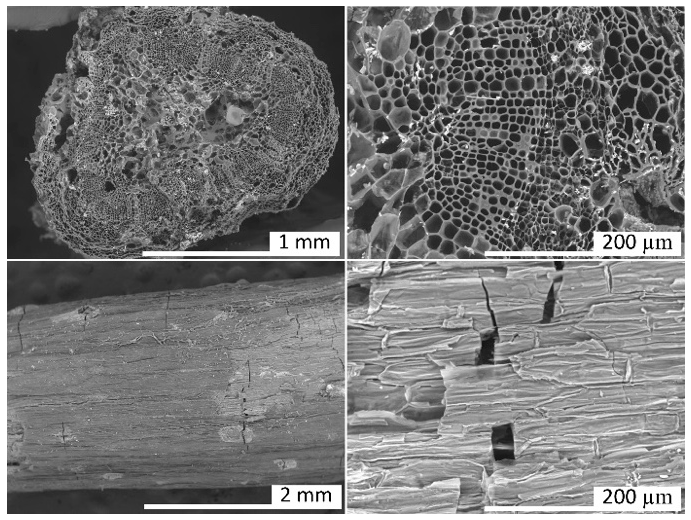
Thermogravimetric analysis (TG-DTG) provided important information related to weight loss in the temperature range chosen for the production of ACs. The TG and DTG curves of grape stalks are presented in Figure 2. Notably, the effective thermal decomposition begins around 200 °C, with the highest weight loss occurring in the temperature ranges of 240–340 °C and 340–560 °C (48%). The mass loss rate was maximal in the interval between the first and second temperature ranges, respectively. The results also indicated a gradual weight loss beyond 560 °C, continuing up to the final temperature. Additionally, it was noted that grape stalks underwent three distinct stages of carbonization with significance: (i) the weight loss below 130 °C is attributed to moisture removal; (ii) the peak in the 35–130 °C range can be attributed to the dehydration of grape stalks [23], where the weight loss was 10%; (iii) as the temperature increased from 130 °C to 360 °C, the decomposition of grape stalks, as shown in the DTG curve, exhibited two peaks. In this context, the peak in the range from 130 °C to 260 °C can be attributed to the pyrolysis of hemicellulose, with a weight loss of approximately 12%, while the peak in the range from 260 °C to 360 °C can be attributed to the pyrolysis of cellulose and lignin, resulting in a weight loss of about 32%. The higher cellulose content in the precursors compared to lignin was confirmed by the results shown in Table 1, which indicated 34.30% and 18.61% by weight, respectively. Characterization of the precursors. 1 by difference 100 − (39.64 + 5.74 + 1.65 + 6.31); 2 by difference 100 − (18.61 + 34.30). These results are consistent with the characteristics of lignocellulosic materials reported by Zeriouh and Belbirl [24] (≈200 °C for hemicellulose, ≈280 °C for cellulose, and ≈350 °C for lignin). The curves display gradual decomposition patterns consistent with lignin degradation. It is known that the decomposition of lignin occurs over a wide temperature range, and its peak decomposition cannot be precisely determined [25]. However, it is believed that the long and flat tail observed at elevated temperatures may be due to the decomposition of lignin. Finally, the carbonization yield of grape stalks and the subsequent activated carbon are presented in Figure 3. From this figure, it can be observed that the AC yield depends on temperature, time, and activating agent. Increasing the temperature leads to the release of chemical components from the volatile carbon, resulting in lower AC yields. These results support the general idea that an increase in carbonization temperature decreases the number of volatiles in the unstable carbon samples. The reported results also align with the TG curve shown in Figure 2. Regarding the different activating agents, it is notable that CO2 causes the lower AC yields, followed by HNO3, and then HCl. The treatment with HNO3 was used to oxidize the porous surface of the carbon, which removed the mineral elements in each cycle, resulting in a yield of 19% in the fourth cycle. Moreover, HCl reacted with the carbon surface, leading to yields above 26%, but with AC having a low surface area. Therefore, CO2 may be considered a good oxidant gas for reaction with the carbon surface, yielding an AC yield around 15%. The results of the BET surface area analysis, total pore volume, micropore and mesopore volumes, and elemental composition of AC are given in Table 2. Textural and chemical characterization of the activated carbons prepared with different activation agents. Note: Sample (activation agent/temperature/time/cycle). The results show that the carbon content does not increase with the increasing S BET area, nor does it follow a clear pattern. However, in cases with large S BET areas, the amount of carbon was greater than 80%. The hydrogen content was lower than that of carbon in all cases, as expected. In most instances, the nitrogen levels were below the initial values; however, during the third and fourth activation cycles of AC with HNO3, the introduced nitrogen content exceeded the initial amount. The elemental composition of the AC does not present a clear pattern because the material is quite heterogeneous and undergoes different reactions during various production processes. Similar results were reported by other authors [26,27]. Table 2 also shows that the S BET surface area and pore volume increase with the number of cycles for HCl and HNO3, and they also increase with the rise in temperature and activation time for CO2. The magnitude of the increase in porosity is directly proportional to the increase in the BET area, possibly indicating that a higher number of cycles (using HNO3) and longer times (using CO2) may lead to a higher S BET area. The improvement in the porous structure, along with a decrease in the yield of AC (Figure 3), suggests an increase in the reaction between the activating agent and carbon. The extended reaction allows the creation of new pores in the carbon, resulting in a higher surface area and pore volume. Figure 4a shows the nitrogen adsorption isotherms for the activated carbons labeled as CO2/700/120/1, HNO3/700/90/3, and HNO3/700/90/4, with S BET areas of 606, 627, and 741 m2/g, respectively. According to the IUPAC classification of physisorption isotherms, all results should be the Type I(b) isotherms, which are found with materials having pore size distributions over a broader range, including wider micropores and possibly narrow mesopores (<~2.5 nm), or should be the mixed types I and II isotherms with type H4 hysteresis loop: (e.g., hierarchical micro-mesoporous materials) [28]. In Figure 4a, it is also observed that the HNO3 activation exhibits a greater slope of the adsorption curve, indicating a well-developed mesopore structure compared to the activated carbon with the CO2 curve. This behavior corroborates with the results shown in Table 2, where the volume of mesopores for HNO3 was greater than for CO2. Based on the micropore and mesopore volumes provided in Table 2, it can be inferred that the mesopores represent about 7% of the total pore volume for the AC CO2/700/120/1, and approximately 26% for the ACs HNO3/700/90/3 and HNO3/700/90/4. Figure 4b shows the pore size distribution for ACs prepared by activation with CO2/700/120/1, HNO3/700/90/3, and HNO3/700/90/4. It is observed that the ACs have a well-developed microporous structure; however, the expansion of Figure 4b between 30 and 50 Å reveals the presence of mesopores for the ACs activated with HNO3. Through activation with CO2, the predominant development of pores occurs mainly in the micropore range (15–20 Å), as confirmed by the pore volume results shown in Table 2. When activation was carried out with CO2, the micropore volume was greater than 93% in all cases. Furthermore, when comparing the three cases shown in Figure 4b, the micropore volume for CO2 activation is higher. The magnified range (30–50 Å) indicates that activations with HNO3 lead to the formation of mesopores, albeit in small quantities. This difference may be explained by the distinct reactions of the reactants—CO2 in gas form and HNO3 in aqueous solution—on the carbon surface due to their different molecular configurations. There are usually four stages in pore development during the activation process: (i) opening of previously inaccessible pores; (ii) creation of new pores by selective activation; (iii) widening of existing pores; and (iv) merging of existing pores due to pore wall breakage [29]. A comparison of AC isotherms (Figure 4a) indicates that activation with HNO3 results in a higher nitrogen adsorption capacity compared to activation with CO2. However, it should be noted that with higher CO2 activation, microporosity is also produced. The increase in microporosity with CO2 may result from its higher reactivity, which accelerates micropore formation through enhanced diffusion into the carbon’s interior, promoting further pore development. On the other hand, CO2 more aggressively attacks the surface of the carbon, leading to a lower yield of the final AC. Although identifying all the chemical species on the surface of an AC is not an easy task, information about the chemical nature of the carbon surface may be obtained using Fourier Transform Infrared Spectroscopy (FTIR), as shown in Figure 5. The spectra for the three runs were very similar, showing essentially the same major peaks but with varied intensities, indicating that the quantitative amounts of functional groups on the surface of the activated carbons were different. The broad band extending between 900 and 1300 cm−1 is attributed to both -C-O stretching and -O-H bending modes of alcoholic, phenolic, and carboxylic groups. Similarly, bands around 1350 cm−1 can be ascribed to O-H and C=O vibration [30]. Around 1420 cm−1, a band appears, which can be attributed to the aromatic C=C stretching mode. The band in the 1620 and 1750 cm−1 region is associated with C=O stretching in carbonyls and lactones [31]. The band around 3430 cm−1 is likely assigned to the O-H stretching vibration mode of hydroxyl functional groups, while the band around 2920 cm−1 is likely attributed to the C-H symmetric and asymmetric vibration modes of methyl and methylene groups [32]. Therefore, it can be inferred that the types of surface functional groups were not significantly affected by the activation method or conditions in this study. The pHPZC, types, and amounts of surface functional groups present in the activated carbon samples were determined by Boehm’s titration, and the results are presented in Table 3. The Boehm analysis results of activated carbons (meq/g). The activation promoted by HNO3 and CO2 generally reacted with the porous carbon surface, enhancing several properties, removing mineral elements, and improving the surface hydrophilicity. Nitric acid activation produced ACs with a pHPZC < 7.6 (pHPZC of carbon), while the CO2 treatment resulted in a value higher than the pHPZC of carbon. Nitric acid treatment introduced a substantial number of oxygen-containing acidic surface groups onto the carbon, whereas CO2 treatment enhanced its basicity. Similar results were found by Shim et al., Liu et al., and Wibowo et al. [33,34,35]. Finally, Figure 6 shows the SEM images for the structures of the ACs produced from grape stalks. The SEM images of sample HNO3/700/90/4, used as an example, show the preservation of the precursor shape after activation. Macroscopically, the carbon sample resembles a small rod or cylinder. The external surface of the ACs is smooth and homogeneous due to the carbonization of the grape stalk coat tissue, with minimal cracks or large macropores, indicating that the outer structure was preserved during carbonization. Depending on the applications of the carbon, the outer layer may be an undesirable resistance for the diffusion of molecules, or it can potentially act as a barrier for separation. On the other hand, the inner layers exposed by the opening of the outer layers of the coat showed a well-developed network of channels and macropores that may provide favorable conditions for the diffusion process. Table 1:
Elemental analysis (wt%)
C
39.64
H
5.74
N
1.65
S
<Id
O 1
46.63
Humidity (wt%)
13.25
Ash (wt%)
6.31
Lignin (wt%)
18.61
Cellulose (wt%)
34.30
Hemicellulose (wt%) 2
47.09
<Id, below detection limit
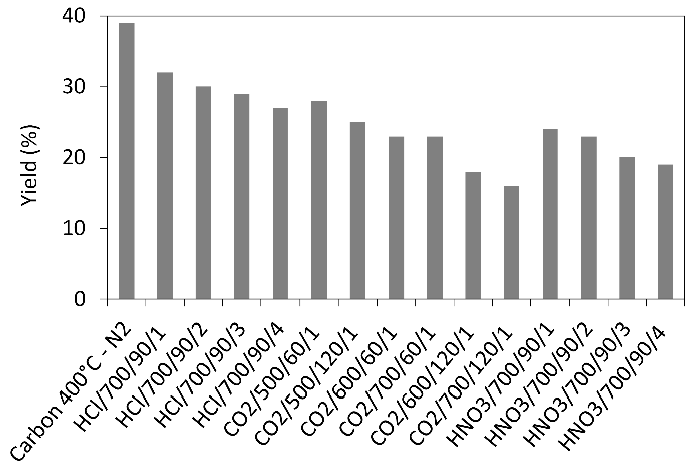 Table 2:
Sample
BET
Vtot
Vmicro
Vmeso
Elemental Composition (wt%)
ABET (m2/g)
(cm³/g)
(cm³/g)
(cm³/g)
C
H
N
Precursor
0.22
39.64
5.74
1.65
Carbon 400°C-N2
18
63.21
3.19
1.31
HCl/700/90/1
123
0.07
0.07
0.00
69.08
0.93
1.11
HCl/700/90/2
139
0.07
0.06
0.01
65.45
0.98
1.09
HCl/700/90/3
269
0.11
0.10
0.01
71.23
0.85
1.27
HCl/700/90/4
296
0.13
0.12
0.01
67.43
0.63
1.22
CO2/500/60/1
311
0.14
0.14
0.00
73.12
1.45
1.51
CO2/500/120/1
325
0.16
0.14
0.02
69.55
1.29
1.21
CO2/600/60/1
360
0.17
0.16
0.01
69.43
0.64
0.84
CO2/700/60/1
439
0.20
0.19
0.01
73.12
0.98
0.65
CO2/600/120/1
472
0.22
0.21
0.01
81.05
0.93
0.78
CO2/700/120/1
606
0.29
0.27
0.02
87.51
1.33
0.44
HNO3/700/90/1
376
0.19
0.15
0.04
75.32
1.45
1.35
HNO3/700/90/2
593
0.30
0.24
0.06
81.22
1.66
1.55
HNO3/700/90/3
627
0.32
0.24
0.08
81.94
1.21
2.39
HNO3/700/90/4
741
0.34
0.25
0.09
82.74
0.73
1.86
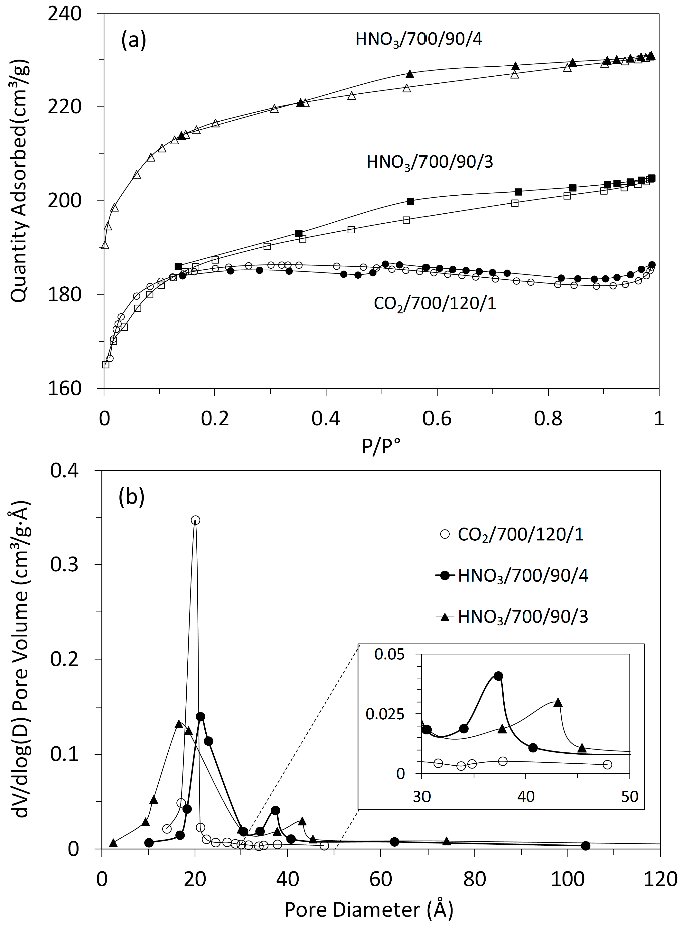
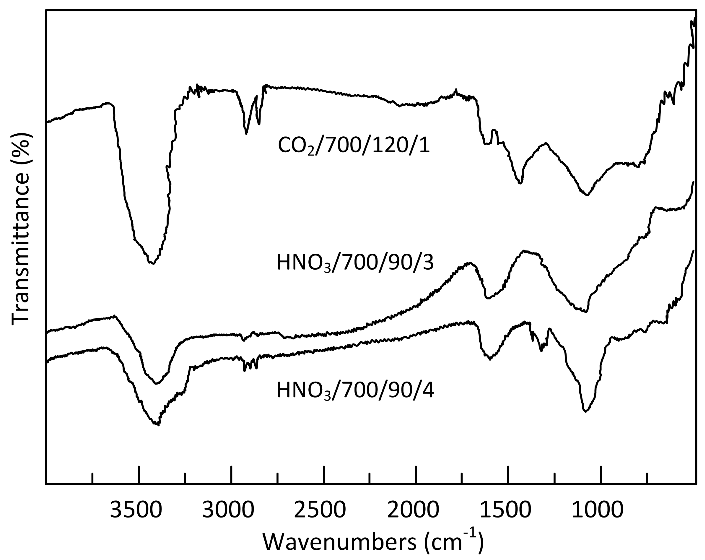 Table 3:
Samples
Acidic Surface Functional Groups
Total Acid
Basic Surface Functional Groups
pHPZC
Carboxyl
Lactonic
Phenolic
Carbon 400°C-N2
0.05
0.13
0.10
0.28
0.05
7.6
CO2/700/120/1
0.35
0.15
0.17
0.67
0.50
7.8
HNO3/700/90/3
0.64
0.09
0.24
0.97
0.32
5.5
HNO3/700/90/4
0.81
0.11
0.19
1.11
0.28
5.2
This study demonstrated the successful production of activated carbons (ACs) from grape stalks, a lignocellulosic by-product of the wine industry, using different activation methods. The results confirmed that both the nature of the activating agent and the activation conditions significantly influence the yield, surface area, porosity, and surface chemistry of the resulting materials. Among the methods tested, chemical activation with HNO3 produced ACs with higher mesoporosity and specific surface area, while physical activation with CO2 favored the development of micropores, albeit with lower yields due to the more aggressive nature of the gas–solid reaction. Thermogravimetric analysis revealed a thermal decomposition behavior consistent with the expected profiles of lignocellulosic materials, with lignin contributing most to the residual carbon content. The elemental and structural analyses confirmed the heterogeneity of the carbon surface and its sensitivity to activation conditions, specifically regarding the formation of oxygenated functional groups and nitrogen incorporation. The S BET surface areas achieved (up to 741 m2/g) and the pore size distribution results indicate that grape stalk-derived ACs hold considerable potential for applications in adsorption processes, particularly where tailored micro- and mesoporosity is beneficial. Furthermore, the valorization of grape stalks aligns with sustainability goals, offering an economical and eco-friendly route for producing high-performance adsorbents from agricultural residues. Future studies should evaluate the adsorption performance of these ACs for specific contaminants in aqueous and gaseous media, along with life-cycle analyses to determine the overall environmental benefits of using grape stalks as carbon precursors.
| ACs | Activated Carbons |
| CO2/500/60/1 | Activating Agent/Temperature/Time/Number of Application Cycles |
| DTG | Derivative Thermogravimetry |
| FTIR | Fourier Transform Infrared Spectroscopy |
| pHPZC | Point of Zero Charge |
| S BET | Brunauer, Emmett, and Teller Specific Surface Area |
| SEM | Scanning Electron Microscopy |
| TG | Thermogravimetric |
| Vmeso | Mesopore volume |
| Vmicro | Micropore volume |
| Vtot | Total pore volume |
| Wf | Weight of the Sample at the End of the Activation Process |
| Wi | Initial Sample Weight |
Conceptualization: O.Z., W.L.P., D.B.; Analysis and execution: O.Z., D.B.; Writing (original draft preparation): O.Z.; Writing (review, editing, and supervision): O.Z., W.L.P.; Figures Creation: O.Z. All authors have read and agreed to the published version of the manuscript.
All used data have already been reported and cited in the manuscript.
No consent for publication is required, as the manuscript does not involve any individual personal data, images, videos, or other materials that would necessitate consent.
The authors declare that they have no known competing financial interests or personal relationships that could have appeared to influence the work reported in this paper.
No external funding was received for this research.
The authors gratefully acknowledge the support and scholarships from Instituto Federal de Educação, Ciência e Tecnologia do Rio Grande do Sul (IFRS). This work has not been previously published, except as part of a thesis Available online: https://lume.ufrgs.br/bitstream/handle/10183/117778/000968675.pdf?isAllowed=y&sequence=1. Accessed on: 22 July 2024.
[1] Zanella, O. Produção de Carvão Ativado a Partir do Engaço da Uva e Estudo da Regeneração Eletroquímica do Mesmo em um Reator Desenvolvido em Escala Laboratorial. Ph.D. Thesis, Universidade Federal do Rio Grande Sul—UFRGS, Porto Alegre, RS, Brazil, 2015. Available online: https://lume.ufrgs.br/bitstream/10183/117778/1/000968675.pdf.
[2] Zanella, O.; Bilibio, D.; Priamo, W.L.; Tessaro, I.C.; Féris, L.A. Electrochemical Regeneration of Phenol-Saturated Activated Carbon—Proposal of a Reactor. Environ Technol. 2017, 38, 549–557. [CrossRef]
[3] Zanella, O.; Tessaro, I.C.; Féris, L.A. Desorption- and Decomposition-Based Techniques for the Regeneration of Activated Carbon. Chem. Eng. Technol. 2014, 37, 1447–1459. [CrossRef]
[4] Arriagada, R.; García, R.; Molina-Sabio, M.; Rodriguez-Reinoso, F. Effect of Steam Activation on the Porosity and Chemical Nature of Activated Carbons from Eucalyptus Globulus and Peach Stones. Microporous Mater. 1997, 8, 123–130. [CrossRef]
[5] Serafin, J.; Dziejarski, B.; Cruz Junior, O.F.; Sreńscek-Nazzal, J. Design of Highly Microporous Activated Carbons Based on Walnut Shell Biomass for H2 and CO2 Storage. Carbon N. Y. 2023, 201, 633–647. [CrossRef]
[6] Patel, H.; Weldekidan, H.; Mohanty, A.; Misra, M. Effect of Physicochemical Activation on CO2 Adsorption of Activated Porous Carbon Derived from Pine Sawdust. Carbon Capture Sci. Technol. 2023, 8, 100128. [CrossRef]
[7] Martins, A.F.; Cardoso, A.d.L.; Stahl, J.A.; Diniz, J. Low Temperature Conversion of Rice Husks, Eucalyptus Sawdust and Peach Stones for the Production of Carbon-like Adsorbent. Bioresour. Technol. 2007, 98, 1095–1100. [CrossRef]
[8] Lawal, S.; Zaini, M.A.A. Dynamic Adsorption Characteristics of Orthophosphate Using Iron-Loaded Coconut Shell-Activated Carbon. Mater. Today Proc. 2023, 96, 90–93. [CrossRef]
[9] Boonamnuayvitaya, V.; Sae-Ung, S.; Tanthapanichakoon, W. Preparation of Activated Carbons from Coffee Residue for the Adsorption of Formaldehyde. Sep. Purif. Technol. 2005, 42, 159–168. [CrossRef]
[10] Torrellas, S.Á.; García Lovera, R.; Escalona, N.; Sepúlveda, C.; Sotelo, J.L.; García, J. Chemical-Activated Carbons from Peach Stones for the Adsorption of Emerging Contaminants in Aqueous Solutions. Chem. Eng. J. 2015, 279, 788–798. [CrossRef]
[11] Galiatsatou, P.; Metaxas, M.; Kasselouri-Rigopoulou, V. Adsorption of Zinc by Activated Carbons Prepared from Solvent Extracted Olive Pulp. J. Hazard. Mater. 2002, 91, 187–203. [CrossRef] [PubMed]
[12] Martin-Martinez, M.; Álvarez-Torrellas, S.; García, J.; Silva, A.M.; Faria, J.L.; Gomes, H.T. Exploring the Activity of Chemical-Activated Carbons Synthesized from Peach Stones as Metal-Free Catalysts for Wet Peroxide Oxidation. Catal. Today 2018, 313, 20–25. [CrossRef]
[13] González, J.F.; Encinar, J.M.; Canito, J.L.; Sabio, E.; Chacón, M. Pyrolysis of Cherry Stones: Energy Uses of the Different Fractions and Kinetic Study. J. Anal. Appl. Pyrolysis 2003, 67, 165–190. [CrossRef]
[14] Shadhin, M.; Rahman, M.; Jayaraman, R.; Chen, Y.; Mann, D.; Zhong, W. Natural Biomass & Waste Biomass Fibers—Structures, Environmental Footprints, Sustainability, Degumming Methods, & Surface Modifications. Ind. Crops Prod. 2023, 204, 117252. [CrossRef]
[15] Daud, W. Comparison on Pore Development of Activated Carbon Produced from Palm Shell and Coconut Shell. Bioresour. Technol. 2004, 93, 63–69. [CrossRef]
[16] Daud, W.M.A.W.; Ali, W.S.W.; Sulaiman, M.Z. Effect of Carbonization Temperature on the Yield and Porosity of Char Produced from Palm Shell. J. Chem. Technol. Biotechnol. 2001, 76, 1281–1285. [CrossRef]
[17] Soest PJVan Wine, R.H. Use of Detergents in the Analysis of Fibrous Feeds. IV. Determination of Plant Cell-Wall Constituents. J. AOAC Int. 1967, 50, 50–55. [CrossRef]
[18] Van Soest, P.J. Use of Detergents in the Analysis of Fibrous Feeds. II. A Rapid Method for the Determination of Fiber and Lignin. J. Assoc. Off. Agric. Chem. 1963, 46, 829–835.
[19] Brunauer, S.; Emmett, P.H.; Teller, E. Adsorption of Gases in Multimolecular Layers. J. Am. Chem. Soc. 1938, 60, 309–319. [CrossRef]
[20] HOHorváth, G.; Kawazoe, K. Method for the Calculation of Effective Pore Size Distribution in Molecular Sieve Carbon. J. Chem. Eng. Jpn. 1983, 16, 470–475. [CrossRef]
[21] Barrett, E.P.; Joyner, L.G.; Halenda, P.P. The Determination of Pore Volume and Area Distributions in Porous Substances. I. Computations from Nitrogen Isotherms. J. Am. Chem. Soc. 1951, 73, 373–380. [CrossRef]
[22] Boehm, H.P. Chemical Identification of Surface Groups. In Advances in Catalysis Volume 16, Eley, D.D.; Pines, H.; Weisz, P.B., Eds.; Academic Press: Cambridge, MA, USA, 1996; 179–274. . [CrossRef]
[23] Herczynska, E. Adsorption Isotherms of Potential Determining Ions. J. Inorg. Nucl. Chem. 1964, 26, 2127–2133. [CrossRef]
[24] Zeriouh, A.; Belkbir, L. Thermal Decomposition of a Moroccan Wood Under a Nitrogen Atmosphere. Thermochim. Acta 1995, 258, 243–248. [CrossRef]
[25] Müller-Hagedorn, M.; Bockhorn, H.; Krebs, L.; Müller, U. A Comparative Kinetic Study on the Pyrolysis of Three Different Wood Species. J. Anal. Appl. Pyrolysis 2003, 68–69, 231–249. [CrossRef]
[26] Nabais, J.V.; Laginhas, C.; Carrott, M.R.; Carrott, P.; Amorós, J.C.; Gisbert, A.N. Surface and Porous Characterisation of Activated Carbons Made from a Novel Biomass Precursor, the Esparto Grass. Appl. Surf. Sci. 2013, 265, 919–924. [CrossRef]
[27] Jimenez-Cordero, D.; Heras, F.; Alonso-Morales, N.; Gilarranz, M.A.; Rodriguez, J.J. Porous Structure and Morphology of Granular Chars from Flash and Conventional Pyrolysis of Grape Seeds. Biomass Bioenergy 2013, 54, 123–132. [CrossRef]
[28] Thommes, M.; Kaneko, K.; Neimark, A.V.; Olivier, J.P.; Rodriguez-Reinoso, F.; Rouquerol, J.; Sing, K.S.W. Physisorption of Gases, with Special Reference to the Evaluation of Surface Area and Pore Size Distribution (IUPAC Technical Report). Pure Appl. Chem. 2015, 87, 1051–1069. [CrossRef]
[29] Lahaye, J.; Ehrburger, P. . Fundamental Issues in Control of Carbon Gasification Reactivity ; Springer: Dordrecht, The Netherlands, 1991; . . [CrossRef]
[30] Álvarez, P.; García-Araya, J.; Beltrán, F.; Masa, F.; Medina, F. Ozonation of Activated Carbons: Effect on the Adsorption of Selected Phenolic Compounds From Aqueous Solutions. J. Colloid Interface Sci. 2005, 283, 503–512. [CrossRef]
[31] Mohan, D.; Singh, K.P.; Singh, V.K. Removal of Hexavalent Chromium from Aqueous Solution Using Low-Cost Activated Carbons Derived from Agricultural Waste Materials and Activated Carbon Fabric Cloth. Ind. Eng. Chem. Res. 2005, 44, 1027–1042. [CrossRef]
[32] Valtsifer, V.A.; Sivtseva, A.V.; Kondrashova, N.B.; Shamsutdinov, A.S.; Averkina, A.S.; Valtsifer, I.V.; Feklistova, I.N.; Strelnikov, V.N. Influence of Synthesis Conditions on the Properties of Zinc Oxide Obtained in the Presence of Nonionic Structure-Forming Compounds. Nanomaterials 2023, 13. [CrossRef]
[33] Wibowo, N.; Setyadhi, L.; Wibowo, D.; Setiawan, J.; Ismadji, S. Adsorption of Benzene and Toluene from Aqueous Solutions onto Activated Carbon and Its Acid and Heat Treated Forms: Influence of Surface Chemistry On adsorption. J. Hazard. Mater. 2007, 146, 237–242. [CrossRef] [PubMed]
[34] Liu, S.; Chen, X.; Liu, Z.; Wang, H. Activated Carbon with Excellent Chromium(VI) Adsorption Performance Prepared by Acid–Base Surface Modification. J. Hazard. Mater. 2007, 141, 315–319. [CrossRef]
[35] Shim, J.-W.; Park, S.-J.; Ryu, S.-K. Effect of Modification with HNO3 and NaOH on Metal Adsorption by Pitch-Based Activated Carbon Fibers. Carbon N. Y. 2001, 39, 1635–1642. [CrossRef]