
APA Style
Mahmoud Said Rashed, Shaimaa Fakhry, Radwa Satour, Mabrouk Sobhy, A.K. Haghi. (2025). Water Footprint and Water Resources Sustainability: A Review. Sustainable Processes Connect, 1 (Article ID: 0017). https://doi.org/10.69709/SusProc.2025.188432MLA Style
Mahmoud Said Rashed, Shaimaa Fakhry, Radwa Satour, Mabrouk Sobhy, A.K. Haghi. "Water Footprint and Water Resources Sustainability: A Review". Sustainable Processes Connect, vol. 1, 2025, Article ID: 0017, https://doi.org/10.69709/SusProc.2025.188432.Chicago Style
Mahmoud Said Rashed, Shaimaa Fakhry, Radwa Satour, Mabrouk Sobhy, A.K. Haghi. 2025. "Water Footprint and Water Resources Sustainability: A Review." Sustainable Processes Connect 1 (2025): 0017. https://doi.org/10.69709/SusProc.2025.188432.
ACCESS
Review Article
Volume 1, Article ID: 2025.0017

Mahmoud Said Rashed
mahmoudsaidrashed88@gmail.com
Shaimaa Fakhry
shaimaa.fakhry@alexu.edu.eg

Radwa Satour
radwasatour@alexu.edu.eg

Mabrouk Sobhy
mabrouk-sobhy@alexu.edu.eg
A.K. Haghi
akhaghi@gmail.com
1 Food Science and Technology Department, Faculty of Agriculture, Alexandria University, Alexandria 21545, Egypt
2 Department of Pomology, Faculty of Agriculture, Alexandria University, Alexandria 21545, Egypt
3 Department of Chemistry, Institute of Molecular Sciences, University of Coimbra, 3004-535 Coimbra, Portugal
* Author to whom correspondence should be addressed
Received: 09 Feb 2025 Accepted: 12 Dec 2025 Available Online: 13 Dec 2025 Published: 25 Dec 2025
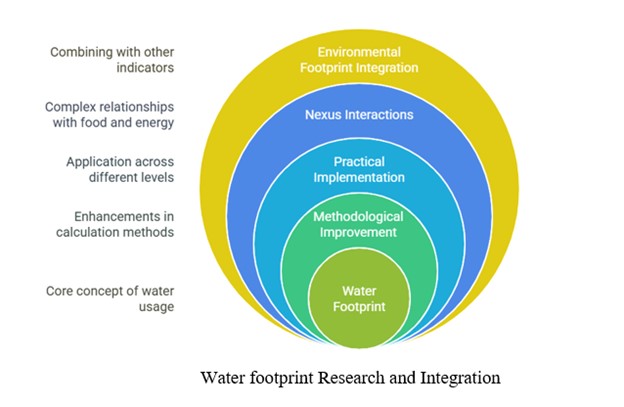
This review provides an overview of recent progress in water footprint research across theoretical development, methodological improvement, and practical implementation at different levels. It analyzes the development of the water footprint concept, reviews existing calculation methods, and discusses their strengths and limitations. The review pays particular attention to interactions within the food–energy–water nexus and demonstrates how water footprint analysis can reveal resource interdependencies and trade-offs. It also highlights the significant progress made in integrating the assessment of the water footprint with other environmental indicators, particularly within the “environmental footprint family”: water, environment, energy, carbon, land, nitrogen, and phosphorus footprints. This review contributes to the growing literature in water resource management. It provides policymakers and researchers with some valuable insights into strategies for sustainable resource use.
Evolution of the Water Footprint Concept Methodological Advances in Water Footprint Calculation Role in the Food-Energy-Water (FEW) Nexus Assessment of Water Resources Sustainability Challenges in Water Footprint Research
The primary challenge to sustainable development in the Anthropocene is the global water crisis, marked by increasing freshwater scarcity and pollution, occurring at a time when human activities have profoundly altered Earth’s systems [1]. Urbanization and economic development, together with population growth, have increased water demand across domestic, industrial, and agricultural sectors. The United Nations projects global population to rise from 8.2 billion in 2022 to 10.9 billion by 2100. Approximately 70 percent of the world’s freshwater withdrawals are for agriculture [2], and in some dry and semi-arid regions, including sub-Saharan Africa, the per capita ratio of internal renewable water resources has decreased by 20 percent between 2000 and 2018 [3]. The pressure is heightened by climate change, which alters rainfall patterns and increases the frequency of extreme weather events, disrupting the water cycle and straining water resources [4]. The global food system is in a state of considerable transformation caused by a variety of factors, among which the most important are population growth, urbanization, and the increase in living standards, thus resulting in a rather noticeable change in the eating habits towards more water-intensive products such as animal proteins and processed foods [5]. This trend has been observed primarily in China, where water demand associated with food production has increased to 860 m3 per capita in 2003, compared with 255 m3 per capita in 1961. The most significant change in water usage in China has been an increase in food consumption, particularly for animal food products. These observable shifts in diet are adding pressure on water resources, and by 2030, total water demand in China for producing food will be immense [6]. The increase in water consumption has also been a result of economic growth and a shift in consumer preferences towards high-water-intensive foodstuffs, including processed foods and animal protein. However, recent studies indicate that an equilibrium between water consumption and economic growth can emerge over the long term [7]. Hoekstra and Chapagain [8] suggest that the water footprint is an extensive method for estimating the amount of fresh water used directly and indirectly in the production and consumption of goods and services. This measure enables the researchers and the policymakers to determine the sustainability of water use in various industries and supply chains by differentiating between the green (rainwater), blue (surface and groundwater), and grey (polluted water) footprints. The water footprint is especially applicable to the agriculture and energy industries, which are essential to global water use and are under threat of water shortages. It is projected that areas already experiencing water shortages will see further reductions in water supply due to shifting climate patterns [9]. Recent advancements in water footprint accounting have identified multiple ways to use water more efficiently. Guo et al. [10] note that several issues remain regarding regional inequalities in water supply and the environmental consequences, particularly the impacts of increased water demand. The purpose of the review is to provide a summary of the existing body of knowledge regarding the accounting of water footprint in achieving water resources sustainability, particularly in the agriculture and energy industries. The discussion begins with the genesis and development of the water footprint concept, proceeds to a review of water footprint methodologies, and concludes with an examination of methods for measuring the water footprint in production and consumption processes. Subsequently, methods for assessing water resources in the context of sustainable development are considered, with particular emphasis on the interactions among water use, economic growth, and environmental impacts. Lastly, we identify research gaps, including the limited incorporation of water footprint information into policy formulation, and propose directions to strengthen sustainable water management. These problems will bring the paper into the scientific and policy debate on how to alleviate the global water crisis.
The water footprint concept emerged from the idea of virtual water. The concept of virtual water was proposed by Allan [11] in 1998 and refers to the amount of water required to produce goods and services. It is the “invisible” form of water contained in the product. For example, if producing 1000 kg of wheat requires 1000 m3 of water, then 1000 m3 is the virtual water content of those 1000 kg. In 2002, Dutch researchers formally articulated the concept of the water footprint, defined as the total volume of water required to produce goods and services within a specified time and location, considering both production and consumption. This idea comes from the theory of “ecological footprint” [12]. The concept of water footprint has attracted the attention of governments and scientists around the world since the first publication of the Water Footprint Assessment Handbook by Aldaya et al. [13]. The water footprint and the concept of virtual water are related but differ in their analytical scope and purpose. What they have in common is that they can be used to analyze the relationships between human production and consumption, water use, and management [14]. The key difference between the two concepts is that virtual water focuses on the water resources embedded in the production of a product, essentially the water consumed to create it, whereas the water footprint encompasses the total water used across both production and consumption processes [15]. In terms of components, virtual water typically accounts for blue and green water, while the water footprint also includes grey water. In terms of scope, the virtual water approach is mainly used for agricultural products and is a valuable tool to balance water scarcity and food security; the water footprint encompasses a wide range of products and services at individual, household, sectoral, regional, and national levels. The water footprint is more advanced than virtual water because virtual water accounts for blue and green water, lacking the comprehensive scope of the water footprint, while the water footprint can characterize the time, place, and type of water use in addition to the amount of water consumed, offering a more advanced analysis compared to virtual water [16] and can also measure the impact of human activities on the region’s ecosystems. A comparison of wheat production in Egypt and the Netherlands helps illustrate these distinctions. Egypt, a nation with limited water resources, relies heavily on irrigation. One ton of wheat requires about 1600 m3 of water. Only 10% is green water due to limited rainfall, while 90% is blue water sourced from the Nile River [17]. In contrast, wheat production in the Netherlands relies more on rainfall and typically uses a higher share of green water. For example, green water may account for ~80% (~1200 m³/ton), while blue water contributes ~20% (~300 m³/ton). The higher irrigation demand (1600 m3/ton in Egypt vs. 1500 m3/ton in the Netherlands) makes Egyptian wheat more water-intensive from a virtual water perspective. However, the water footprint analysis would additionally consider virtual water imports (e.g., from water-rich countries) and grey water reflecting pollution from fertilizer run-off on Egyptian farms (estimated at 200 m3/ton), which is higher due to lower regulation and higher input use per hectare. The Dutch water footprint, on the other hand, considers consumption patterns, including exported wheat and minimal grey water (~50 m3/ton) due to efficient agricultural practices. This case study demonstrates that while the water footprint offers a more comprehensive and policy-relevant assessment of water use and its sustainability impacts across all production and consumption systems at different scales, virtual water trade analysis primarily focuses on water consumption during production [16]. While virtual water and water footprint serve different purposes, they are both vital for sustainable water management. Virtual water helps address water scarcity through trade analysis. In contrast, the water footprint provides a holistic view of water-use impacts, aiding comprehensive environmental assessments. This not only opens up a new way of thinking about the integrated management of water resources but also offers an entirely new perspective for realizing the sustainable use of water resources [18,19].
3.1. Composition of the Water Footprint The water footprint is a multidimensional indicator of water use that encompasses blue, green, and grey water [8,20]. Blue water refers to liquid water in rivers, lakes, wetlands, and aquifers and is the type most commonly examined in traditional water resource studies. Green water includes two components: green water flow, which refers to the water that evaporates from soil, water bodies, and vegetation; and green water storage, which relates to soil moisture maintained in the unsaturated zone, formed by precipitation and available for plant use. Grey water is a measure of the extent of water contamination and is defined as the amount of freshwater needed to absorb pollutants to meet existing environmental water quality standards [12]. In terms of water use boundaries, the water footprint includes an internal water footprint and an external water footprint [8], where the internal water footprint of a region is the amount of water used, excluding imported products and services, and the external water footprint is the amount of water included in imported products and services in the form of virtual water. Water footprints are characterized by different temporal and spatial scales, including global, national, provincial, municipal, and watershed scales, as well as temporal scales such as years, months, or days. 3.2. Accounting for the Water Footprint The extent to which humans have reached or even exceeded the planetary boundaries of freshwater resources is a central concern for global sustainable development [21]. As illustrated in Figure 1, balancing food, energy and water are all important resources that are essential for human survival. These three are interdependent and interact with each other, forming the Food-Energy-Water (FEW) system [22]. In the context of climate change and societal transformation, maintaining the health of the ecosystem and providing sufficient food, energy, and water resources for the increasing population and managing the resulting water footprint are of great importance to ensure people’s water, food, and energy security. 3.2.1. Method for Calculating the Water Footprint of Food Production in the Agricultural Production Process As defined, the agricultural water footprint comprises green, blue, and grey components. According to Allen et al. [23], the agricultural water footprint is usually calculated as follows: (1) Green water footprint: if evapotranspiration (ET) exceeds adequate precipitation (P) during the growing season, the green water footprint equals the effective P; if ET is less than effective P, the green water footprint equals the actual ET. (2) Blue water footprint: This depends on the crop’s tolerance to water scarcity, irrigation efficiency, and the availability of green water. If evapotranspiration (ET) exceeds precipitation (P), the blue water footprint equals ET minus P; otherwise, the blue water footprint is zero. Complete information on irrigation, soil, and cultivation is required to calculate the blue water footprint. (3) The grey water footprint: This quantifies the freshwater needed to dilute pollutants from agricultural activities to meet environmental quality standards. Nitrogen fertilizers are considered as one of the major contributors to grey WF [24]. Phosphorus, also from fertilizers, has a significant impact on water bodies as it causes eutrophication and requires considerable dilution [25]. Two examples of emerging pollutants that are increasingly significant yet difficult to quantify due to their complex interactions and limited data are pharmaceuticals originating from manure or wastewater irrigation, and microplastics derived from mulch films [16]. Sophisticated modelling tools (e.g., SPARE: WATER) are required to capture the persistence of these pollutants in the environment [26]. Together, these components constitute the overall water footprint. While traditionally based on nitrate leaching, the grey water footprint increasingly accounts for multiple pollutants. It is calculated using the following formula:
According to various researchers, there are different models for simulating the water footprint of crop production. These models include the CROPWAT model [27,28], the GEPIC model [29] (GIS-based environmental policy integrated climate model), the Environmental Policy Integrated Climate (EPIC) and the AquaCrop model [30]. The most widely used model for calculating the water footprint of crops is the CROPWAT model [31,32]. The primary advantage of the CROPWAT model is its flexibility and adaptability, enabling its application to a wide range of crops in nearly any location worldwide, while allowing for model localization and adjustment of calculation accuracy. Table 1 summarizes the main tools for assessing the water footprint of agricultural production. At the international level, water footprint studies are usually conducted either at the global or country level. For example, Tuninetti et al. [33] project the global consumption of green and blue water for wheat, rice, maize, and soybeans. These assessments reveal that crop production primarily relies on green water, with blue water becoming more efficient when irrigation is applied [33]. WF estimates are sensitive to various input parameters, particularly reference evapotranspiration (ET0) and crop coefficients (Kc). Blue water footprints (WFs) tend to be more sensitive to input variability than green water footprints. The sensitivity of WFs varies across crop types, water supply methods, and regional climates. Uncertainties in WF estimates due to combined input uncertainties can be around ±26% at a 95% confidence level [34,35]. Figure 2 illustrates the calculations of agricultural water footprints.
| Model/Tool | Developer/Source | Main Features | Strengths | Limitations | References |
|---|---|---|---|---|---|
| CROPWAT | FAO | Calculates crop water requirements and irrigation needs based on climatic and crop data | Widely used, easy to operate, adaptable to various locations, supports multiple crops | Limited pollutant modelling requires accurate local climate and soil data | [27,28] |
| GEPIC | IIASA & CAU | Integrates GIS data with crop models and environmental data to estimate crop production and water use | Spatially explicit; considers land use, hydrology, and environmental impacts | Complex setup; limited access to input data in data-scarce regions | [29] |
| EPIC | USDA | Simulates crop growth and environmental impacts, including nutrient runoff and sediment transport | Includes nutrient and pesticide leaching; suited for policy assessment | Requires detailed input data; complex calibration | [36] |
| AquaCrop | FAO | Focuses on the relationship between water and yield in response to different water conditions | Simple interface; water productivity-focused; suitable for scenario analysis | Limited pollutant tracking; does not account for grey water components directly | [30] |
| SPARE: WATER | ZALF, Germany | Integrative tool for analyzing WF and water productivity at the farm level using a systems approach | Holistic integration of social-ecological dynamics; suitable for comparative studies | Still under limited use, high data and calibration demands | [37] |
| WaterStat/WF Assessment Tool | Water Footprint Network | Online tool following Hoekstra’s methodology for calculating green, blue, and grey WF | Transparent methodology; consistent with global WF standards | Limited crop-specific detail; primarily used for awareness/policy rather than detailed farm management | [18] |
| WaNuLCAS | ICRAF | Simulates nutrient and water dynamics in agroforestry systems | Good for mixed cropping/agroforestry; nutrient and water flow dynamics | Limited to agroforestry systems; not standardized for WF estimation | [38] |
Research on water footprints spans global and regional scales and addresses different policy objectives. Global studies aim to identify countries with high agricultural water consumption to reduce the overall water footprint [39]. For instance, in China, a modified water footprint assessment framework revealed that 24.9% of water consumed by grain crops is transferred to animal products through feed grain [40]. Regional studies, such as those of the Chinese province of Liaoning, use input-output analysis to compare water footprints from both production and consumption perspectives. They help identify sectors with high water footprints and provide policy recommendations, such as changes in industrial structure and trade, water-saving technologies, and capacity-building to reduce the stress on water scarcity [41].
3.2.2. Method for Calculating the Water Footprint of Energy Production
The International Energy Agency has also conceptualized energy security as “uninterrupted access to energy supply at an affordable price”. Energy and water are interdependent and critical resources, and the “water–energy nexus” has been a longstanding focus of research. The energy sector is highly resource-intensive, and the degradation of water quality, quantity, and availability threatens the sustainability of energy supply [42]. Greenhouse gas emissions from the energy sector also influence the hydrological cycle at a global scale. These feedbacks can jeopardize the water–energy nexus [43]. The water footprint of energy is determined by pollution intensity during the extraction, processing, and purification phases [44], specifically the blue and grey water footprint. Water consumption and pollution in energy production, along with energy development planning based on water resources, serve as valuable functional indicators for optimizing the efficiency of water resource use. For example, Peña et al. [45] used a life cycle approach to estimate the blue water footprint of ore mining and processing in the Atacama Desert in northern Chile.
The water footprint of energy production should be assessed using tools such as life cycle assessment (LCA) and input-output analysis (IO), which are inseparable for clearly explaining the water-energy nexus. These approaches allow for optimizing resource flows, especially on a small scale, where attentive evaluation can facilitate sustainable practices. For instance, in calculating the water footprint of energy production, small- and large-scale impacts are weighted equally, with the small scale allocated to the flows of the respective departments. This approach is essential for describing the multidimensional interactions in the water-energy nexus and for optimizing resource use. Small-scale studies usually employ models and methods to examine and optimize flows to manage resources effectively.
Input-output (IO) models have been widely applied to measure the virtual water content of economic activities and to depict the water footprint of different sectors in terms of environmental impact, including the energy sector. The importance of input-output models is that they help assess the flow of water resources in energy production and assist in evaluating and managing the environment. These models, which comprise both demand- and supply-side components, help predict sectoral outputs and inputs by combining cross-sectoral transactions with final demand forecasts. These models help understand the flow of resources among sectors and identify inefficiencies and potential areas for improvement. These models are specifically applicable to the water-energy nexus; optimizing water use in energy generation is crucial for sustainability [46]. Input–output models facilitate the tracking of water flows within the energy production process and play a central role in environmental assessment. Quantitative approaches, such as mathematical modeling and decision-support systems, enhance water resource management through real-time monitoring and prediction. These instruments enable adaptive management and real-time monitoring, allowing better-informed decisions [47]. A decentralized structure for the optimization of micro water-energy nexus (MWEN) systems is proposed to enhance resource supply and enable separate management of the water and energy sectors. Silva-Rodriguez & Li [48] propose a decentralized co-optimization model based on a goal-centered alternating direction method of multipliers (OB-ADMM) to optimize operations while preserving the confidentiality of resource providers.
Life cycle assessment (LCA) models evaluate the environmental impact of energy products throughout their life cycle, including water consumption. These models examine and optimize the water-energy nexus by minimizing the water footprint and maximizing the economic and energy outcomes per unit of water consumed. These models help to identify trade-offs between energy production and water resource consumption and to promote synergies within the water-energy-food nexus. These models provide a comprehensive representation of resource flows and optimize their impact within the value chain [49]. According to various authors, LCA models are primarily employed to link water and food systems with the energy system by simulating the different types of interconnections and resource transfers among them. Consequently, they can capture broader impacts of resource consumption [50]. For example, research by Kock et al. [51] developed a novel framework for the Water-Energy-Food Nexus of energy products that considers food footprint and water scarcity indicators, and applied it to biodiesel production in Argentina to highlight the potential impacts on land use and water, and the need for integrated assessment.
While the research examines individual industrial resource chains on a smaller scale, larger models incorporate broader interdependencies, including the Nexus between energy, water, and food. The models and frameworks are needed to develop sustainable resource management practices that address both local and international problems. This is mainly because the entire production chain needs to be considered to calculate the energy-water footprint. Given the impact of energy types, manufacturing processes, and information at each link, it is difficult to identify the production chain. In addition, industrial and energy products account for only a small portion of the virtual water trade, and consequently, relatively little research has focused on this area.
3.3. Food-Energy-Water (FEW) Relevance
The water footprint method is designed to facilitate the integrated management of water resources. The Harvard Water Resources Project Milliman (1962) was the first to propose an interdisciplinary, integrated social and environmental approach to water resources management. However, the implementation of many water resources management plans, including this project and Integrated Water Resources Management (IWRM), has often fallen short of expectations. There are three main reasons for this: (1) The IWRM project attempts to integrate all seemingly water-related resource elements, but their scope is not clearly defined; (2) The IWRM project focuses only on water resources and has a single accounting purpose; (3) The issue of unclear or inconsistent scope. In the past, water resource accounting methods mainly were limited to the river basin scale. For resources such as energy and food, which are based on statistical data from administrative units, accounting methods are limited. FEW also follows a cross-sectoral integration approach, but its more advanced features are: (1) FEW has a clearer accounting object, namely food, energy and water resources; (2) FEW does not need to focus only on water, and stakeholders from the agriculture and energy sectors are more likely to participate; (3) The choice of scale is more flexible and free, both river basins and administrative units can be used as units of analysis. The 2011 World Conference on Green Economic Development emphasized that food, energy, and water resources are fundamental pillars of sustainable development, with water playing a central role within the FEW nexus [52]. The inclusion of WF in the FEW models is an essential step to enable effective management of resources because it quantifies the consumption of water by sectors and points out trade-offs and synergies. One such significant real-world example is the Sponge City Initiative in China, launched in 2014 to address urban flooding, water pollution, and water scarcity with the help of low-impact development (LID) and green infrastructure. In Shenzhen, a pilot Sponge City, urban planning was informed by optimizing rainwater retention, reducing the blue WF for urban water supply by 15% (from 1.2 billion m3 to 1.02 billion m3 annually) and the need for energy-intensive water treatment by 10% [53]. These water savings supported urban agriculture by reallocating the saved water for irrigation, improving local food security, and reducing the virtual WF of food imports by 8%. By integrating permeable pavements, green roofs, and wetlands, the initiative minimized runoff, reduced energy consumption for drainage systems, and increased food production, demonstrating the policy relevance of the FEW Nexus [54]. Such examples highlight the importance of WF metrics in operationalizing the FEW frameworks for sustainable urban planning, even if scaling these practices in different hydrological contexts remains a challenge [55].
In the past, most studies have focused on the relationship between the two, especially the application of the water footprint to the study of the “water-food” Nexus and the “water-energy” Nexus. After the World Conference on Greening the Economy in 2011, the study of the FEW has dramatically increased, and the research contents include three aspects: (1) the concept of the FEW Nexus; (2) the modelling and simulation of the FEW Nexus; (3) the study of use cases, the identification of trade-offs and synergies of the FEW Nexus, and the formulation of cross-sectoral strategies for sustainable regional development. In the literature, the most commonly used methods for studying the FEW nexus can be classified into four main categories: (1) the ecological footprint method by Vanham [56], who studied the applicability of the water footprint to the FEW nexuses; (2) economic methods, such as the Computable General Equilibrium (CGE) method. Computable general equilibrium (CGE) models are particularly well suited to analyzing environmental policy and the food–energy–water (FEW) nexus, as they can evaluate both the costs and benefits of policy changes across multiple economic levels [57,58]. Integrated modelling methods, such as those described by Dale et al. [59], the authors systematically analyzed the water and energy use of the electricity generation system in California, USA, in the context of climate change, combining this with a hydrological model and long-term energy substitution planning; (3) online modelling platforms specifically used to assess the FEW Nexus include the “FEW Nexus Assessment Tool 2.0” [60]. There are more studies at the global, national, and cross-regional levels, but fewer studies at the city level. Ramaswami et al., [61] analyzed the relationship between food, energy, and water in New Delhi, India, from the perspective of urban systems. Domestic FEW correlation research started late but is receiving increasing attention. Figure 3 demonstrates the integration of the water Footprint into FEW nexuses.
In a series of System Dynamics Models (SDMs), different frameworks have been applied to investigate the sustainability of the food-energy-water (FEW) Nexus in various contexts. Aquaponics systems have been studied in peri-urban food production systems [62], in general aquaponics research [63], and in urban areas, where they have been used for systemic modelling to investigate sustainable practices [31,64]. SDM can reveal different interactions in FEW systems and thus becomes a tool for decision-making and informing policy processes about sustainability [62,63]. This has been used to describe the imbalanced relationships between supply and demand, to evaluate specific policies, or conduct scenario analysis to secure the resources of megacities optimally [31]. At the same time, SDM has also been used in considering the sustainability transition for urban FEW infrastructures, with particular attention to climate, policy drivers, and land use context [64]. Documented examples increasingly demonstrate the generalizability of SDM in addressing the challenges of the FEW Nexuses, including the sustainable management of resources at various scales and in diverse environments.
In summary, while there is a consensus on the need to include blue, green, and grey water in the water footprint assessment, there are differences in the choice of accounting methods, with CROPWAT preferred for agriculture and LCA for the energy sector, reflecting sectoral differences in data availability and complexity.
Water is a vital resource provided by natural ecosystems for human survival. Its sustainable use is an essential guarantee for sustainable regional development. Building on the understanding of water footprint calculation methods discussed in Section 3, this section examines how these methods are used to assess the sustainability of water resources. The sustainability of water resources refers to maintaining the stability of the ecosystem and supporting social and economic development, as outlined in the theory of sustainable development. Its core task is the orderly development of the economy under the premise of protecting the environment and meeting the water needs of present and future generations [65]. The sustainability of water resources is assessed based on three dimensions: Environmental, social, and economic. The assessment of the sustainability of water resources was initially referred to as “impact assessment” and is divided into primary and secondary impact [12]. Primary impacts are typically characterized using indicators of water shortage and stress. Figure 4 illustrates a representation of water resource sustainability assessment. Early methods for assessing water scarcity focused primarily on blue water, ignored green and grey water, and did not account for spatial and temporal changes in water resources. The most widely used methods are the Falkenmark Index [66], the water footprint-to-available water ratio [67], and the Water Poverty Index (WPI) [68]. In terms of application, Karabulut et al. [69] used the Falkenmark Index to assess water shortage in the Danube River Basin. These assessments typically involve calculating the ratio of water consumption to water availability, commonly referred to as the water stress index or water scarcity indicator [70,71]. Results consistently show that agriculture is the largest water consumer, often accounting for over 90% of total water use. These analyses shed light on water management and how unsustainable water consumption can be avoided [72]. Rockström et al. [21] made the first progress in quantifying green water deficits by formulating a so-called Green Water-Blue Water Index. This index assesses the extent of water scarcity based on the ratio of blue and green water footprints relative to local blue and green water supply. It characterizes the water deficit caused by pollution through the ratio of grey water footprint to water resources. This is an improvement of the water footprint theory-based water resource supply and demand index. Zeng et al., [73] comprehensively considered the indicators of water quality and quantity and analyzed the water supply and use of Beijing by calculating the ratio of water footprint and water resources in the basin. The Quantity-Quality-Environment (QQE) index comprehensively considers water quality, water quantity, and ecological water demand [74]. The secondary impacts of water scarcity refer to the loss of ecological, social, and economic goods and services resulting from the primary effects of water shortage and water quality degradation. These include the decline of ecosystem services, threats to food and energy security, adverse effects on human health, and disruptions to water-dependent economic activities. Most methods for assessing water resource sustainability integrate indicators from multiple fields, among which Life Cycle Assessment (LCA) is widely used. Boulay et al., [75] combined the water stress index, LCA, and human development index to assess the combined impact of water quality degradation and food production reduction due to water resource depletion on human well-being. According to Aldaya et al., [13], the Water Footprint Manual changed the term “impact assessment” to “sustainability assessment of water resources”, which better reflects the connotation of water resource management. The assessment methods are mainly divided into three categories: 1) the indicator assessment method; 2) the product sustainability assessment method related to the life cycle of water; 3) the comprehensive assessment method. In indicator-based assessment methods, the Environmental Performance Index (EPI) integrates multiple domains, including water resources, forest resources, and waste management, while gross domestic product (GDP) and gross national product (GNP) are used to evaluate social and economic sustainability [76]; the well-being index consists of two parts: the Human Well-being Index (HWI) and the Ecosystem Well-being Index (EWI) [77]. The HWI covers population, prosperity, knowledge, culture, and fairness, while the EWI summarizes indicators of resource use, such as water and land. The method for assessing product sustainability in relation to the life cycle of water focuses on measuring the energy and material flow of production and services, as well as evaluating the use and environmental impact of water resources throughout their life cycle. The environmental impacts of water resources are often regarded as less significant, while the social and economic dimensions receive comparatively less attention. Commonly used methods include Life Cycle Assessment (LCA) (Gluch et al., Life Cycle Costing (LCC) [78], material flow analysis of products [79], and energy flow analysis of products [80]. Comprehensive assessment methods are usually interdisciplinary, such as system dynamic models in complex problem scenarios [81]. IEEE, pressure-state response models covering social, economic, environmental, and political aspects [79], etc. In addition, there are various methods for assessing water resource vulnerability that combine social, economic, and ecological dimensions and aim to determine the sensitivity and resilience of human and environmental systems to changes in driving forces [82]. There are various indicators and methods for assessing the sustainability of water resources, each offering different perspectives on water scarcity, quality, and socio-economic impacts. Researchers agree that integrating the environmental, social, and economic dimensions is essential; however, the absence of a standardized methodology results in varied approaches depending on the context.
5.1. Current Challenges (1) Data limitations are one of the biggest challenges in calculating the water footprint. They affect accuracy both in agriculture (data on grey water pollution from pesticides, nitrogen, phosphorus, and microplastics) [16] and in the energy sector (data on production and the supply chain obscure the distinction between water demand and actual consumption) [44]. The complexity of the estimation methods and deviations caused by overlaps among multiple departments affect the accuracy of water footprint calculations [83]. Insufficient data on water conservation facilities, for example, make it impossible to assess whether “physical water scarcity” or “economic water scarcity” influences policy decisions. The timeliness of WF assessments for dynamic resource management is limited, and substantial delays result from the conventional dependence on product input-output tables, which are updated every five years [84]. On the other hand, recent developments have significantly increased the water data’s temporal resolution. To monitor water balance in real time, the GRWNOD platform, launched in 2023, offers high-frequency, open-access, near-real-time data on water consumption in urban, industrial, and agricultural areas [83]. In areas where traditional monitoring is infrequent or delayed, it enables dynamic tracking of greywater contamination and provides reliable data for water footprint modeling. Complementary tools such as IoT-based smart metering supported by Low-Power Wide-Area Networks provide granular data for urban and industrial WF calculations and improve the accuracy of consumption tracking [85]. Remote sensing platforms, such as OpenET, utilize satellite data to provide field-scale estimates of evapotranspiration. According to Thaler et al. [84], there are three areas where the accuracy of water footprint models needs to be improved: (i) data acquisition and pre-processing, (ii) calibration of model parameters, and (iii) methodological innovations tailored to sectoral and regional conditions. These limitations must be addressed for water footprint (WF) sustainability studies to be optimally utilized in decision-making, as highlighted in Section 4 [83]. To provide context to the challenges, Table 2 summarizes the primary water footprint research studies and highlights their methods, results, and identified gaps to improve the accuracy of agricultural WF [86]. Even when environmental water demand is included in the calculation, most calculations assume it is a fixed percentage of water flow. Ecological water demand varies across regions and seasons, and techniques for measuring or simulating regional ecological water demand remain underdeveloped. The reliability and accuracy of the water footprint calculation results are the basis for the sustainability assessment (Section 3.1) and the formulation of policy measures. Therefore, improved methods for simulating regional ecological water demand, combined with high-frequency data, are needed to increase the reliability of the water footprint. (2) A major challenge is the mismatch between the scales at which water is managed (often administrative) and the scales at which water processes and impacts occur (often seasonal and hydrological). Song et al. [102] in their research found that the spatial mismatch is greater than the temporal mismatch, especially in regions of high urbanization. Temporal scales are unable to distinguish among the different seasons, while geographical scales are unable to account for the movement of water and its different forms, such as virtual water. To manage water effectively, the correct scale must be chosen since different scales can initiate different management practices [103]. Seasonal water shortages are commonly underappreciated in interannual studies and therefore lead to false predictions of water supply and demand [104]. For example, for India’s Indo-Gangetic Plain, seasonal WF assessments for rice revealed 28% higher green WF during the monsoon months (July–September) compared with interannual averages (2500 m3/ton vs. 1950 m3/ton) due to significant variability in rainfall [105]. In sub-Saharan Africa, the estimated water demand for sorghum varied by 22% between the wet and dry seasons (1600 m3/ton vs. 2050 m3/ton), with interannual models underestimating water stress in the dry season by 12% [106]. These examples underscore the need for an adaptive timescale for WF research, as both short- and long-term climatic variability play dominant roles in water supply [107]. Water footprint accounting can support sustainable water management in large, semi-arid catchments by mapping the spatial and temporal patterns of sectoral water use [108]. Recent findings emphasize the links between climate variability, water resources, and socio-economic status. Short-term climatic fluctuations, particularly heavy rainfall, play a critical role in determining drinking water quality in developing countries [109]. High/low temperature and drought in farming regions negatively impact farmers’ psychological status, especially drought [110]. Prolonged hydrological extremes have persistent impacts on Sub-Saharan African wealth disparities, and dryness and wetness reduce regional GDP per capita [111]. Climate change is altering rainfall patterns, resulting in shorter and more intense rainy seasons that threaten water and food security in vulnerable regions [112]. These results show that adaptation measures and investments are needed to prevent future impacts on water resources and socio-economic well-being. Effective water resource management and policy decisions, therefore, depend on the careful selection of appropriate spatial and temporal scales for specific research objectives. In this context, the length of the study changes the results. For example, China’s evolving agricultural water footprint between 2000 and 2019 was influenced by significant route dependence and geographical dependence [113]. Calculation of the water footprint at the selected spatial level is complicated by the flow of water resources and the virtual availability of water [108]. This complication arises because both direct and indirect water consumption, as well as the multiple impacts of human management and weather conditions across different locations, must be considered. For example, Mao et al. [114] state that the water footprint is distributed differently across spatial scales (e.g., crop field, county, river basin) and is influenced by local management practices and climatic conditions. These findings are in agreement with those of Zhuo et al. [115], who found that different spatial scales yield distinct responses to water use in agriculture. The virtual water trade, that is, water embedded in exported and imported goods, must be updated to estimate regional water dependence [116]. Accurate calculation of virtual water is often hindered by a lack of data and methodological sophistication, making national water resources planning challenging [47]. Effective water management, therefore, requires a nuanced understanding of both local and global water flows, highlighting the need for spatially explicit assessments. Consequently, the precise choice of spatial scale is often independent of regulatory decisions, which in turn could alter the perceived upper limits of water resource use [107]. Aligning spatio-temporal scales with the characteristics and objectives of specific research topics facilitates a better understanding of water distribution and use, ultimately supporting the development of effective response strategies. Spatio-temporally disaggregated information can provide opportunities for water saving and offer strategic planning insights for further sustainable water management policies in large basins [108]. While choosing the correct spatial and temporal scale is crucial, it is equally important to consider the broader context of water resources management. This requires a good understanding of the socio-economic and environmental factors that affect water use and availability, in the wider context of how policy decisions affect the sustainability of water management. However, these issues require more global solutions as they evolve, i.e., by bringing together diverse data and methodologies to examine the dynamics of water resources holistically. (3) Grey and green water footprint assessments are essential for sustainable water management under favorable conditions in urban landscapes and agriculture. The water footprint of crops has mostly been analyzed in the green domain, often overlooking the contributions of trees, pastures, and urban greenery. The analysis of grey water also needs improvement, especially regarding the self-purifying capacity of water bodies and the increasingly complex nature of pollutants. These topics are described in more detail in the following sections. The green water footprint is the amount of rainwater consumed during plant growth, especially in agriculture. However, it is essential to know that urban green spaces within the metropolitan area also contribute to the water footprint. Unfortunately, these contributions are not consistently considered when valuing such areas [16]. Extending the green water footprint to recreational areas and forests could be one way to address the failure of urban water management systems [117]. In contrast, the grey water footprint quantifies the volume of water required to assimilate pollutants. Current methods are simple and do not capture the complex interaction of different pollutants [37]. Complex models such as SPARE: WATER provide extensive calculations due to the factors of the environment in which it exists, combined with the complexity of the pollutants [17]. Future studies should focus on integrating multiple variables into the assessment of the grey water footprint to provide a more accurate representation of environmental impacts [16]. Conversely, some argue that too much emphasis on the water footprint would undermine other large-scale approaches to optimizing the economical and efficient use of water. One school of thought suggests that a holistic approach is needed to use and manage water resources efficiently. (4) The unequal distribution of water resources is evident in the disparities in per capita water consumption across countries worldwide, posing an additional challenge. Political dynamics, socio-economic development, and geographical conditions contribute to these differences. In this context, the work by Yalew et al. [118] highlighted that areas with higher levels of economic development have larger water footprints. The authors attributed this to the increased consumption and industrial activity. Furthermore, the relocation of production to less developed regions leads to greater pollution and resource degradation, which perpetuates inequalities [119]. A study of 27 countries from 1960 to 2010 found an N-shaped relationship between urban water use and GDP, known as the cubic water Kuznets curve [120]. In China, the urban water footprint was found to be 1.6 to 3.7 times higher than the rural footprint, with consumption levels accounting for the differences between provinces [121]. Globally, around 70% of countries exhibit an inverted U-shaped trend in water consumption due to technological progress and the optimization of production structures. The Organization for Economic Co-operation and Development (OECD) is a 36-member intergovernmental economic organization established in 1961 with the objective of economic growth and international trade [35]. OECD nations have abolished competition-restricting regulations and harmonized their product market policies to a greater extent [122]. The OECD countries with the highest water consumption typically generate over 60% of their GDP in the service sector, have an urbanization rate of 70%, and a GDP per capita of over $20,000 [108]. The results above show the complex nature of the relationships among economic growth, urbanization, and water use patterns. Current studies focus on implementing distributive justice principles to manage water resources in ways that optimize equity and consider hydrological efficiency. Traditional models tend to overlook socio-economic impacts, thereby further aggravating inequalities [118]. Incorporating considerations of morality and distributive justice into the IWRM framework could promote equitable and sustainable water distribution, particularly in regions experiencing water scarcity [123]. Equity principles in running water systems can reconcile equity and efficiency, expand the space for solutions, and indirectly benefit poor people [124]. Equity in water distribution is considered central to a more equal future, and equity takes precedence over efficiency and markets in water policy [108]. This research highlighted the need for interdisciplinary collaboration and robust policy support to develop models that are technically sound and incorporate social equity provisions, aligning water resources management with higher social values of equity and sustainability. Indices of equality, such as the Gini coefficient and Theil index, have been used in recent studies to quantify fair access to water sources across provinces and to provide numerical data on spatial and population inequality [125]. The Gini coefficient, a standard economic measure of income inequality, is a statistical indicator of dispersion ranging from 0 (equality) to 1 (maximum inequality). In the context of water resource distribution, it is assessed by plotting the Lorenz curve of cumulative water supply against cumulative population or supply area and calculating the ratio of the area between the line of equality and the Lorenz curve to the total area under the line of equality. Similarly, the Theil Index is an entropy-based measure of inequality that breaks down overall inequality into within-group and between-group components. For this reason, it is particularly suitable for analyzing nested spatial scales, such as municipal, provincial, and national levels. The following formula is used for the calculation:
Study
Year
Focus Area
Methods
Main Findings
Gaps
Ref.
Water scarcity in semi-arid climate countries
1989
Falkenmark Index
Water scarcity assessment
Defined water stress based on per capita water availability
Does not account for water quality and temporal variability
[66]
Virtual water and global solutions to regional deficits
1998
Concept of virtual water.
Conceptual development.
Introduced virtual water as a strategic resource to address regional deficits.
Lacked quantification and application to specific sectors.
[11]
Green and grey water footprint for crop production
1998
Water footprint components
Water footprint accounting
Defined blue, green, and grey water footprints.
Needed more detailed accounting methods for different sectors.
[11]
Integrated assessment of water stress and scarcity
2002
Water Poverty Index
Composite index
Integrated social, economic, and environmental dimensions
Complex to calculate, needs validation in different contexts
[68]
Water consumption for food production
2005
Green and blue water resources
Hydrological assessment
Distinguished between green and blue water, emphasizing green water’s role.
Limited focus on greywater and pollution.
[87]
Consumption patterns across nations
2007
Water footprint of nations
Water footprint accounting
Quantified water use by people as a function of their consumption pattern.
Did not fully integrate the grey water footprint.
[8]
Spatial quantification of water footprint
2008
Global water footprint for crops
Lund-Potsdam-Jena managed Land model
Analyzed green and blue water consumption for major crops globally.
Sensitivity to input parameters and regional variability.
[88]
Analyzing the availability of green-blue water
2009
Green Water-Blue Water Index
Hydrological modelling
Assessed water scarcity considering both green and blue water.
Requires detailed data on water use and availability
[21]
Analyzing impact assessment
2011
Combined water stress index and LCA
Life cycle impact assessment
Linked the water footprint to human well-being.
Needs standardization and broader application
[89]
Analysis of water footprint
2011
Water supply and use in Beijing
Water footprint accounting
Analyzed water use in Beijing, considering the water footprint.
Focused on one city, needs comparison with other regions
[90]
Quantification of water footprint for global crop production
2011
Green, blue, and grey water footprint of crops
Global assessment
Provided comprehensive data on the water footprints of various crops
Data limitations for some regions and crops
[17]
Analyzing water scarcity problems
2013
Regional water footprint
Input-output analysis
Assessed water footprint in Liaoning, China, from production and consumption perspectives
Limited to the regional scale, needs global comparison
[41]
Evolvement of water footprint assessment
2013
Water footprint in energy production
Life cycle assessment
Quantified water footprint in the energy sector.
Data gaps in supply chain water use.
[91]
Assessment of water scarcity
2017
QQE index
Integrated assessment
Considered quantity, quality, and environment in water assessment.
Complex model, needs simplification for practical use
[92]
Analyzing the nexus between economic growth and water usage
2017
Water consumption and economic development
Empirical analysis
Linked the water footprint to economic growth
Needs to consider social equity and sustainability
[93]
Assessment of the water footprint in the EU energy sector
2019
Green and blue water footprint components of the energy sector
Three-stage assessment (Production, Construction, Operation)
Provided a comparative analysis between the water footprints of various energy production systems in the EU.
Needed more detailed accounting for the impact of climate change.
[94]
Accounting for the grey water footprint
2020
Data availability for grey water
Data analysis
Highlighted data gaps in the grey water footprint assessment.
Requires better data collection and sharing
[95]
Application of advanced techniques to ensure environmental sustainability and freshwater ecosystem conservation
2021
Green, blue, and grey water footprints
Review
Emphasized the need for improved grey water accounting
Requires standardized methods and data
[96]
Determining the effect of climatic conditions on water scarcity
2022
Agricultural water footprint
Crop water requirement calculation
Provided methods for calculating evapotranspiration in agriculture.
Focused primarily on blue water, less on green and grey
[97]
Regional water footprint assessment
2022
Water footprint in large basins
Case study
Mapped water footprint in large semi-arid basins
Limited to specific basins, needs a global perspective
[98]
FEW Nexuses and circular economy
2024
FEW Nexuses and sustainable development
Integrated assessment
Integrated Framework for WEF Nexus Management.
The predominantly qualitative nature of some socio-anthropological models.
[99]
Regional water footprint assessment
2024
FEW Nexuses and sustainable development
Integrated assessment
Highlighted the importance of FEW Nexuses for sustainability
Requires more case studies and policy integration
[100]
Water, energy, food, and environment nexus
2024
Sustainable transition
Integrated assessment
Interventions in one sector (e.g., water use) significantly impact others (e.g., food production, energy generation, and ecosystem health)
Lack robust methods to handle uncertainty, Data and Tool limitations
[101]
These indices are helpful in identifying areas experiencing oversupply (i.e., uneven water supply to a population or region) or undersupply (i.e., uneven allocation). For example, Yu et al. [125] employed the Gini coefficient to reveal substantial inequalities in the water supply systems of rapidly growing Chinese provinces. Li et al. [31] advanced this approach by developing a composite framework for evaluating water resource sustainability, which includes security (measured by resilience indicators), efficiency (measured by water productivity indicators), and equity (measured by the Gini coefficient) to assess the multi-layered sustainability of water resource systems. In the context of advancing water sustainability, this holistic perspective encompasses not only water availability and use efficiency but also equitable and just access for all population groups.
All these interventions have promoted a more equitable distribution of water. However, managing the international water regime and establishing mechanisms for international cooperation remain significant challenges. Addressing these concerns, therefore, requires an approach that effectively balances local needs and international sustainability requirements.
5.2. Future Research Perspectives
Future research must focus on exploring the FEW Nexuses by integrating ecosystem services and developing effective, comprehensive management practices. The Food–Energy–Water (FEW) nexus is recognized as a key driver of sustainable development, reflecting the complex interdependencies among these critical resources [99]. Integrated management practices should be implemented to enhance resource efficiency and minimize inefficiencies [126]. Analysts have employed predictive mathematical modeling tools and techniques to support FEW nexus planning, including advanced multi-criteria optimization methods and composite decision-making indices [126,127]. These techniques enable the identification of Nexus synergies and trade-offs, leading to improved resource management, policy planning, and formulation. The interconnections, linkages, and efficiency within the FEW nexus have been examined across most sectors, with gaps and opportunities for future improvement identified [128]. Stakeholders adopting a Nexus perspective can drive resource efficiency and sustainable action, thereby facilitating the achievement of the Sustainable Development Goals [99].
The Nexus approach to FEW addresses the interconnections between these sectors explicitly and recognizes that a shift in one industry significantly affects the other two drivers [129]. This holistic approach is necessary for sustainable resource management and for achieving the Sustainable Development Goals [99]. Various studies have suggested different quantitative models to characterize the FEW Nexus, such as input-output models to analyze interlinkages among sectors [130] and multi-criteria decision-making models to optimize production and resource use [131]. These help to identify synergies and trade-offs in agricultural land use systems [126]. Agricultural crops such as alfalfa are susceptible to energy and water use [130]. For example, according to Nie et al. [126], Pareto solutions could maximize food production, save water and energy, and function efficiently under a wide range of climatic conditions.
Political will and commitment are essential to foster synergies among stakeholders pursuing complementary goals within the basin. Ideally, cross-sectoral stakeholder engagement ensures the representation of different perspectives that would improve the coherence and efficiency of resource management strategies [132]. The concept of the FEW Nexuses seems promising to address some of the sustainability challenges. However, there are still critical bottlenecks in its operationalization, and much more research is needed to conceptualize and effectively use these linkages. Research linking theories and methods across food, energy, water, and ecosystem services is still at an early stage, and there is limited literature to date that integrates ecosystem services into a broader, more comprehensive system. There is a need for multidisciplinary and interdisciplinary comprehensive studies and breakthroughs from many case studies. There is also a great need for cooperation and coordination at transboundary and regional levels, as well as for pursuing compensation mechanisms to make water resources sustainable.
Use the “environmental footprint family” indicator to assess the environmental sustainability dimension of the human-environment system. The sustainability of the human-environment system includes social, economic, and ecological dimensions, with environmental sustainability as the foundation of social and economic sustainability. The family of ecological footprints includes the water footprint, carbon footprint, nitrogen footprint, phosphorus footprint, land footprint, energy footprint, and others [133]. Their common feature is that they can quantify human use of natural resources and comprehensively assess the ecological sustainability dimension of the coupled human-environment system. The concept of the ecological environmental footprint family is well-suited for addressing the limitations of focusing on a single resource while ignoring others, as it takes into account the environmental impacts of multiple resource use, which is particularly important for achieving sustainable regional development. Therefore, including the environmental impacts of social and economic growth in the assessment of the “footprint family” [134] is a new research idea and direction that considers sustainable development, the comprehensive development of society, economy, and environment.
The primary challenges in water footprint research include data limitations, methodological inconsistencies, and issues related to spatial and temporal scales. While there is a consensus on the need for improved data and methods, future research should focus on developing standardized protocols and integrated models to fill these gaps.
In summary, despite several problems and challenges in existing research, water footprint accounting, particularly the theory and method of linking food, energy, water, and other ecosystem services, can provide important scientific and technological support for fulfilling human well-being, reducing trade-offs in resource use, promoting mutual synergies, and fostering sustainable regional development.
The WF has become a key analytical concept for understanding and managing water resources amid mounting global pressures, including population growth, urbanization, climate change, and economic development. The review outlines the principal developments in WF research, from its theoretical foundations in virtual water to its sophisticated application in agriculture, energy, and urban systems. A combination of blue, green, and grey WF components, supported by tools such as CROPWAT and LCA, has enabled advanced water consumption quantification and revealed inherent interdependencies within the FEW Nexuses. Operational applications, such as the China Sponge City program, demonstrate how WF metrics can contribute to integrated urban planning by reducing blue WF by 15% and improving food security through water redistribution. Similarly, quantitative insights into seasonal versus interannual WF variability, such as the 28% higher green WF for rice in India and the 22% variability for sorghum in Sub-Saharan Africa, emphasize the importance of adaptive temporal scales for precision water management. Despite these advances, several limitations remain. Very scarce data, particularly for grey WF pollutants such as microplastics and pharmaceuticals, and methodological heterogeneity constrain accuracy. Disparities in spatio-temporal patterns, i.e., asymmetrical seasonal water scarcity, obstruct resource planning, while the uneven dispersion of water, as reflected in the Gini index value of 0.42 and the Theil index value of 0.35, underscores the need for an equity policy. The integration of WF into sustainability analysis, using indicators such as the Quantity-Quality-Environment (QQE) index and the ecological footprint family, provides an integrated approach to environmental, social, and economic concerns. Future research will require prioritizing standardized processes for increasing the reliability and comparability of WF and the inclusion of high-frequency data from platforms such as GRWNOD and OpenET. The extension of the FEW Nexuses framework by including ecosystem services and cross-boundary collaboration will be crucial in addressing global water challenges. By promoting interdisciplinary models and cross-sectoral stakeholder engagement, WF research can drive sustainable resource management aligned with the Sustainable Development Goals. Ultimately, the WF paradigm provides a firm foundation for evidence-informed policy-making that acknowledges the means by which water scarcity can be avoided, equity can be improved, and the human-environmental system’s resilience can be ensured in a water-scarce future.
EPIC
Environmental Policy Integrated Climate
FEW
Food–Energy–Water
GRWNOD
Global Real-time Water Network Observation Database
IO
Input–Output (Analysis/Model)
IoT
Internet of Things
IWRM
Integrated Water Resources Management
Kc
Crop Coefficient
LCA
Life Cycle Assessment
OpenET
Open Evapotranspiration (Satellite Remote Sensing Platform)
QQE
Quantity–Quality–Environment Index
Theil Index
Indicator of inequality and spatial disparity
WF
Water Footprint
Conceptualization: M.S.R. and A.K.H.; Software, data curation, writing—original draft preparation, writing—review and editing: S.F. and M.S.; Formal analysis, visualization, writing—review and editing: R.S. All authors have read and agreed to the published version of the manuscript.
The authors confirm that the data supporting the findings of this study are available within the article.
The authors declare no conflicts of interest.
The study did not receive any external funding and was conducted using only institutional resources.
Declared none.
The authors employed InstaText (an AI-powered language editing tool) for refining the manuscript and utilized Napkin.AI (an AI-powered tool) for assistance in modifying selected figures.
[1] Lewis, S.L.; Maslin, M.A. Defining the Anthropocene. Nature 2015, 519, 171–180. [CrossRef] [PubMed]
[2] Racheeti, P.B. Water Crisis Escalation: Global Challenges and Urgent Imperatives-Review. Int. J. Adv. Res. 2024, 12, 703–710. [CrossRef] [PubMed]
[3] Camkin, J.; Neto, S. Technology, Practice, Learning, and Policy: Foundations to Address Water Scarcity in Africa and Beyond. World Water Policy 2023, 9, 675–677. [CrossRef]
[4] Schaeffer, R.; Szklo, A.S.; Lucena, A.F.P.; Borba, B.S.M.C.; Nogueira, L.P.P.; Fleming, F.P.; Troccoli, A.; Harrison, M.; Boulahya, M.S. Energy Sector Vulnerability to Climate Change: A Review. Energy 2012, 38, 1–12. [CrossRef]
[5] Willaarts, B.; Pardo, I.; de la Mora, G. Urbanization, Socio-Economic Changes and Population Growth in Brazil: Dietary Shifts and Environmental Implications. In Proceedings of the “XXVII IUSSP International Population Conference”, Busan, Republic of Korea, 24–29 August 2013. Available online: https://www.researchgate.net/publication/258110443_Urbanization_socioeconomic_changes_and_population_growth_in_Brazil_dietary_shifts_and_environmental_implications.
[6] Liu, J.; Savenije, H.H.G. Food Consumption Patterns and Their Effect on Water Requirement in China. Hydrol. Earth Syst. Sci. 2008, 12, 887–898. [CrossRef]
[7] Wang, S.; Sun, Z.; Liu, J.; Zhou, A. Water Resource Utilization Assessment in China Based on the Dynamic Relationship between Economic Growth and Water Use. Water 2024, 16, 1325. [CrossRef]
[8] Hoekstra, A.Y.; Chapagain, A.K. The Water Footprints of Morocco and the Netherlands: Global Water Use as a Result of Domestic Consumption of Agricultural Commodities. Ecol. Econ. 2007, 64, 143–151. [CrossRef]
[9] Jones, E.R.; Bierkens, M.F.P.; van Vliet, M.T.H. Future Global Water Scarcity Including Quality under Climate and Socioeconomic Change; Copernicus GmbH: Göttingen, Germany, 2025. [CrossRef]
[10] Guo, L.; Li, X.; Wang, L. Economic Size and Water Use Efficiency: An Empirical Analysis of Trends across China. Water Policy 2022, 24, 117–131. [CrossRef]
[11] Allan, J.A. Virtual Water: A Strategic Resource Global Solutions to Regional Deficits. Groundwater 1998, 36, 545–546. [CrossRef]
[12] Ay, H. Virtual Water Trade: A Quantification of Virtual Water Flows between Nations in Relation to International Crop Trade. Proc. Int. Expert Meet. Virtual Water Trade 2003, 12, 25–47. [View Online]
[13] Aldaya, M.M.; Chapagain, A.K.; Hoekstra, A.Y.; Mekonnen, M.M. The Water Footprint Assessment Manual; Routledge: New York, NY, USA, 2012. [CrossRef]
[14] Lu, Y.; Liu, X.W.; Zhang, X.Y. Research Progress on Water Footprint in Agricultural Products. Ying Yong Sheng Tai Xue Bao 2015, 26, 3207–3214. [PubMed]
[15] Liao, X.; Liu, A.; Chai, L. Virtual Water Flows in a Real World. PLoS Water 2024, 3, e0000275. [CrossRef]
[16] Fatima, A.; Parihar, A.S.; Yadav, S.; Tiwari, B.; Srivastava, D. Water Footprint: Making the Invisible Visible; Iterative International Publisher: Chikmagalur, India, 2024. [CrossRef]
[17] Mekonnen, M.M.; Hoekstra, A.Y. The Green, Blue and Grey Water Footprint of Crops and Derived Crop Products. Hydrol. Earth Syst. Sci. 2011, 15, 1577–1600. [CrossRef]
[18] Hoekstra, A.Y.; Mekonnen, M.M. The Water Footprint of Humanity. Proc. Natl. Acad. Sci. USA 2012, 109, 3232–3237. [CrossRef]
[19] Vanham, D.; Bidoglio, G. The Water Footprint of Agricultural Products in European River Basins. Environ. Res. Lett. 2014, 9, 064007. [CrossRef]
[20] Hoekstra, A.Y.; Chapagain, A.K. Water Footprints of Nations: Water Use by People as a Function of Their Consumption Pattern; Springer: Dordrecht, The Netherlands, 2006. [CrossRef]
[21] Rockström, J.; Falkenmark, M.; Karlberg, L.; Hoff, H.; Rost, S.; Gerten, D. Future Water Availability for Global Food Production: The Potential of Green Water for Increasing Resilience to Global Change. Water Resour. Res. 2009, 45, 7. [CrossRef]
[22] Lant, C.; Baggio, J.; Konar, M.; Mejia, A.; Ruddell, B.; Rushforth, R.; Sabo, J.L.; Troy, T.J. The U.S. Food–Energy–Water System: A Blueprint to Fill the Mesoscale Gap for Science and Decision-Making. Ambio 2018, 48, 251–263. [CrossRef] [PubMed]
[23] Allen, R.G.; Smith, M.; Pereira, L.S.; Raes, D.; Wright, J.L. Revised FAO Procedures for Calculating Evapotranspiration: Irrigation and Drainage Paper No. 56 with Testing in Idaho; American Society of Civil Engineers: Reston, VA, USA, 2001. [CrossRef]
[24] Moss, B. Water Pollution by Agriculture. Philos. Trans. R. Soc. B Biol. Sci. 2007, 363, 659–666. [CrossRef] [PubMed]
[25] Mekonnen, M.M.; Hoekstra, A.Y. Global Anthropogenic Phosphorus Loads to Freshwater and Associated Grey Water Footprints and Water Pollution Levels: A High-Resolution Global Study. Water Resour. Res. 2018, 54, 345–358. [CrossRef]
[26] Flint, E.M.; Ascott, M.J.; Gooddy, D.C.; Stahl, M.O.; Surridge, B.W.J. Anthropogenic Water Withdrawals Modify Freshwater Inorganic Carbon Fluxes across the United States. Environ. Sci. Technol. 2025, 59, 3949–3960. [CrossRef]
[27] Clarke, D.; Smith, M.; El-Askari, K. CropWat for Windows: User Guide; IHE: Oak Brook, IL, USA, 2001 Available online:; Available online: https://www.researchgate.net/publication/312903822_CropWat_for_Windows_User_guide.
[28] Smith, M. CROPWAT: A Computer Program for Irrigation Planning and Management (No. 46); Food & Agriculture Organization: Rome, Italy, 1992 Available online:; Available online: https://ia801303.us.archive.org/18/items/bub_gb_p9tB2ht47NAC_2/bub_gb_p9tB2ht47NAC.pdf.
[29] Liu, J.; Williams, J.R.; Zehnder, A.J.B.; Yang, H. GEPIC—Modelling Wheat Yield and Crop Water Productivity with High Resolution on a Global Scale. Agric. Syst. 2007, 94, 478–493. [CrossRef]
[30] Steduto, P.; Hsiao, T.C.; Raes, D.; Fereres, E. AquaCrop—The FAO Crop Model to Simulate Yield Response to Water: I. Concepts and Underlying Principles. Agron. J. 2009, 101, 426–437. [CrossRef]
[31] Li, D.; Zuo, Q.; Zhang, Z. A New Assessment Method of Sustainable Water Resources Utilization Considering Fairness-Efficiency-Security: A Case Study of 31 Provinces and Cities in China. Sustain. Cities Soc. 2022, 81, 103839. [CrossRef]
[32] Yu, A.; Cai, E.; Yang, M.; Li, Z. An Analysis of Water Use Efficiency of Staple Grain Productions in China: Based on the Crop Water Footprints at Provincial Level. Sustainability 2022, 14, 6682. [CrossRef]
[33] Tuninetti, M.; Tamea, S.; D’Odorico, P.; Laio, F.; Ridolfi, L. Global Sensitivity of High-Resolution Estimates of Crop Water Footprint. Water Resour. Res. 2015, 51, 8257–8272. [CrossRef]
[34] Zhuo, L.; Mekonnen, M.M.; Hoekstra, A.Y. Sensitivity and Uncertainty in Crop Water Footprint Accounting: A Case Study for the Yellow River Basin. Hydrol. Earth Syst. Sci. 2014, 18, 2219–2234. [CrossRef]
[35] Li, Z.; Feng, B.; Wang, W.; Yang, X.; Wu, P.; Zhuo, L. Spatial and Temporal Sensitivity of Water Footprint Assessment in Crop Production to Modelling Inputs and Parameters. Agric. Water Manag. 2022, 271, 107805. [CrossRef]
[36] Williams, J.R.; Jones, C.A.; Kiniry, J.R.; Spanel, D.A. The EPIC Crop Growth Model. Trans. ASAE 1989, 32, 497–511. [CrossRef]
[37] Multsch, S.; Al-Rumaikhani, Y.A.; Frede, H.G.; Breuer, L. A Site-sPecific Agricultural Water Requirement and Footprint Estimator (SPARE:WATER 1.0). Geosci. Model Dev. 2013, 6, 1043–1059. [CrossRef]
[38] Van Noordwijk, M.; Lusiana, B. WaNuLCAS, a Model of Water, Nutrient and Light Capture in Agroforestry Systems. Agrofor. Syst. 1998, 43, 217–242. [CrossRef]
[39] Hoekstra, A.Y.; Mekonnen, M.M. Reply to Ridoutt and Huang: From Water Footprint Assessment to Policy. Proc. Natl. Acad. Sci. USA 2012, 109, E1425. [CrossRef]
[40] Kang, M.; Wang, Y.; Zhu, Y.; He, F.; Jiang, S.; Yang, M. Optimizing the Structure of Food Production in China to Improve the Sustainability of Water Resources. Sci. Total Environ. 2023, 900, 165750. [CrossRef]
[41] Dong, H.; Geng, Y.; Sarkis, J.; Fujita, T.; Okadera, T.; Xue, B. Regional Water Footprint Evaluation in China: A Case of Liaoning. Sci. Total Environ. 2013, 442, 215–224. [CrossRef] [PubMed]
[42] Davies, E.G.R.; Kyle, P.; Edmonds, J.A. An Integrated Assessment of Global and Regional Water Demands for Electricity Generation to 2095. Adv. Water Resour. 2013, 52, 296–313. [CrossRef]
[43] Schewe, J.; Heinke, J.; Gerten, D.; Haddeland, I.; Arnell, N.W.; Clark, D.B.; Dankers, R.; Eisner, S.; Fekete, B.M.; Colón-González, F.J.; et al. Multimodel Assessment of Water Scarcity under Climate Change. Proc. Natl. Acad. Sci. USA 2013, 111, 3245–3250. [CrossRef] [PubMed]
[44] Ding, N.; Liu, J.; Yang, J.; Lu, B. Water Footprints of Energy Sources in China: Exploring Options to Improve Water Efficiency. J. Clean. Prod. 2018, 174, 1021–1031. [CrossRef]
[45] Peña, C.A.; Huijbregts, M.A.J. The Blue Water Footprint of Primary Copper Production in Northern Chile. J. Ind. Ecol. 2013, 18, 49–58. [CrossRef]
[46] Bon, R. Qualitative Input-Output Analysis; Routledge: New York, NY, USA, 2024. [CrossRef]
[47] Chai, L.; Han, A.; Yan, X.; Ma, S. Employing Input-Output Model to Assess the Water Footprint of Energy System; Springer: Singapore, 2021. [CrossRef]
[48] Silva-Rodriguez, J.; Li, X. Decentralized Micro Water-Energy Co-Optimization for Small Communities. Electr. Power Syst. Res. 2024, 234, 110611. [CrossRef]
[49] Garcia, D.; You, F. Life Cycle Network Modeling Framework and Solution Algorithms for Systems Analysis and Optimization of the Water-Energy Nexus. Processes 2015, 3, 514–539. [CrossRef]
[50] Al-Ansari, T.; Korre, A.; Nie, Z.; Shah, N. Development of a Life Cycle Assessment Model for the Analysis of the Energy, Water and Food Nexus; Elsevier: Amsterdam, The Netherlands, 2014. [CrossRef]
[51] Kock, S.; Piastrellini, R.; Arena, A.P. Assessment of the Water-Energy-Food Nexus in the Life Cycle of Energy Products. Heliyon 2024, 10, e31961. [CrossRef]
[52] Hoff, W.D. Understanding Functional Tuning, Robustness, and Evolvability in Proteins By High-Throughput Biophysics. Biophys. J. 2011, 100, 49a. [CrossRef]
[53] Wang, H.; Shi, Q.; Li, H.; Di, D.; Li, Z.; Jiang, M. A Study of the Temporal and Spatial Evolutionary Characteristics of Water Ecological Footprint Based on the Emergy-Spatial Autocorrelation Method. SSRN Electron. J. 2022. [CrossRef]
[54] Arthur, M.; Liu, G.; Hao, Y.; Zhang, L.; Liang, S.; Asamoah, E.F.; Lombardi, G.V. Urban Food-Energy-Water Nexus Indicators: A Review. Resour. Conserv. Recycl. 2019, 151, 104481. [CrossRef]
[55] Ma, Y.; Jiang, Y. Ecosystem-Based Adaptation to Address Urbanization and Climate Change Challenges: The Case of China’s Sponge City Initiative. Clim. Policy 2022, 23, 268–284. [CrossRef]
[56] Vanham, D. Does the Water Footprint Concept Provide Relevant Information to Address the Water–Food–Energy–Ecosystem Nexus? Ecosyst. Serv. 2016, 17, 298–307. [CrossRef]
[57] Wajsman, N. The Use of Computable General Equilibrium Models in Evaluating Environmental Policy. J. Environ. Manag. 1995, 44, 127–143. [CrossRef]
[58] Nielsen, T.; Schünemann, F.; McNulty, E.; Zeller, M.; Nkonya, E.; Kato, E.; Meyer, S.; Anderson, W.; Zhu, T.; Queface, A.; et al. The Food-Energy-Water Security Nexus: Definitions, Policies, and Methods in an Application to Malawi and Mozambique. SSRN Electron. J. 2015. [CrossRef]
[59] Dale, L.L.; Karali, N.; Millstein, D.; Carnall, M.; Vicuña, S.; Borchers, N.; Bustos, E.; O’hagan, J.; Purkey, D.; Heaps, C.; et al. An Integrated Assessment of Water-Energy and Climate Change in Sacramento, California: How Strong is the Nexus? Clim. Change 2015, 132, 223–235. [CrossRef]
[60] Daher, B.T.; Mohtar, R.H. Water–Energy–Food (WEF) Nexus Tool 2.0: Guiding Integrative Resource Planning and Decision-Making. Water Int. 2015, 40, 748–771. [CrossRef]
[61] Ramaswami, A.; Boyer, D.; Nagpure, A.S.; Fang, A.; Bogra, S.; Bakshi, B.; Cohen, E.; Rao-Ghorpade, A. An Urban Systems Framework to Assess the Trans-Boundary Food-Energy-Water Nexus: Implementation in Delhi, India. Environ. Res. Lett. 2017, 12, 025008. [CrossRef]
[62] Francisco, É.C.; de A. Ignácio, P.S.; Piolli, A.L.; Dal Poz, M.E.S. Food-Energy-Water (FEW) Nexus: Sustainable Food Production Governance through System Dynamics Modeling. J. Clean. Prod. 2023, 386, 135825. [CrossRef]
[63] Francisco, E.C.; Freato, T.A.; Piolli, A.L.; Poz, M.E.S.D. Analysis of the Aquaponic System Sustainability via System Dynamics Modelling—FEW Nexus Approach. Circ. Econ. Sustain. 2024, 5, 2577–2592. [CrossRef]
[64] Valencia, A.; Zhang, W.; Chang, N.B. Sustainability Transitions of Urban Food-Energy-Water-Waste Infrastructure: A Living Laboratory Approach for Circular Economy. Resour. Conserv. Recycl. 2022, 177, 105991. [CrossRef]
[65] Mays, L.W. Lessons from the Ancients on Water Resources Sustainability; Springer: Dordrecht, The Netherlands, 2010. [CrossRef]
[66] Falkenmark, M.; Lundqvist, J.; Widstrand, C. Macro-Scale Water Scarcity Requires Micro-Scale Approaches. Nat. Resour. Forum 1989, 13, 258–267. [CrossRef]
[67] Vörösmarty, C.J.; Green, P.; Salisbury, J.; Lammers, R.B. Global Water Resources: Vulnerability from Climate Change and Population Growth. Science 2000, 289, 284–288. [CrossRef] [PubMed]
[68] Sullivan, C. Calculating a Water Poverty Index. World Dev. 2002, 30, 1195–1210. [CrossRef]
[69] Karabulut, A.; Egoh, B.N.; Lanzanova, D.; Grizzetti, B.; Bidoglio, G.; Pagliero, L.; Bouraoui, F.; Aloe, A.; Reynaud, A.; Maes, J.; et al. Mapping Water Provisioning Services to Support the Ecosystem–Water–Food–Energy Nexus in the Danube River Basin. Ecosyst. Serv. 2016, 17, 278–292. [CrossRef]
[70] Bonamente, E.; Rinaldi, S.; Nicolini, A.; Cotana, F. National Water Footprint: Toward a Comprehensive Approach for the Evaluation of the Sustainability of Water Use in Italy. Sustainability 2017, 9, 1341. [CrossRef]
[71] Zhao, S.; Lin, J.; Cui, S. Water Resource Assessment Based on the Water Footprint for Lijiang City. Int. J. Sustain. Dev. World Ecol. 2011, 18, 492–497. [CrossRef]
[72] Pellicer-Martínez, F.; Martínez-Paz, J.M. The Water Footprint as an Indicator of Environmental Sustainability in Water Use at the River Basin Level. Sci. Total Environ. 2016, 571, 561–574. [CrossRef] [PubMed]
[73] Zeng, Z.; Liu, J.; Savenije, H.H.G. A Simple Approach to Assess Water Scarcity Integrating Water Quantity and Quality. Ecol. Indic. 2013, 34, 441–449. [CrossRef]
[74] Liu, J.; Liu, Q.; Yang, H. Assessing Water Scarcity by Simultaneously Considering Environmental Flow Requirements, Water Quantity, and Water Quality. Ecol. Indic. 2016, 60, 434–441. [CrossRef]
[75] Boulay, A.M.; Bouchard, C.; Bulle, C.; Deschênes, L.; Margni, M. Categorizing Water for LCA Inventory. Int. J. Life Cycle Assess. 2011, 16, 639–651. [CrossRef]
[76] Hsu, A.; Zomer, A. Environmental Performance Index; Wiley: Hoboken, NJ, USA, 2016. [CrossRef]
[77] Prescott-Allen, R. The Wellbeing of Nations: A Country-by-Country Index of Quality of Life and the Environment; Island Press: Washington, DC, USA, 2001 Available online:; Available online: https://books.google.ae/books?id=LvlOAAAAMAAJ&redir_esc=y.
[78] Gluch, P.; Baumann, H. The Life Cycle Costing (LCC) Approach: A Conceptual Discussion of Its Usefulness for Environmental Decision-Making. Build. Environ. 2004, 39, 571–580. [CrossRef]
[79] Spangenberg, J.H.; Femia, A.; Hinterberger, F.; Schütz, H.; Bringezu, S.; Liedtke, C.; Moll, S.; Schmidt-Bleek, F. Material Flow-Based Indicators in Environmental Reporting; European Environment Agency Copenhagen: Copenhagen, Danmark, 1999; 14. Available online: https://api.semanticscholar.org/CorpusID:10110044.
[80] Herendeen, R.A. Energy Analysis and EMERGY Analysis—A Comparison. Ecol. Modell. 2004, 178, 227–237. [CrossRef]
[81] Caulfield, C.W.; Maj, S.P. A Case for Systems Thinking and System Dynamics. IEEE. [CrossRef]
[82] Turner, B.L., II; Kasperson, R.E.; Matson, P.A.; McCarthy, J.J.; Corell, R.W.; Christensen, L.; Eckley, N.; Kasperson, J.X.; Luers, A.; Martello, M.L.; et al. A Framework for Vulnerability Analysis in Sustainability Science. Proc. Natl. Acad. Sci. USA 2003, 100, 8074–8079. [CrossRef]
[83] Ansorge, L.; Stejskalová, L.; Vološinová, D.; Dlabal, J. Limitation of Water Footprint Sustainability Assessment: A Review. Eur. J. Sustain. Dev. 2022, 11, 1. [CrossRef]
[84] Thaler, S.; Zessner, M.; De Lis, F.B.; Kreuzinger, N.; Fehringer, R. Considerations on Methodological Challenges for Water Footprint Calculations. Water Sci. Technol. 2012, 65, 1258–1264. [CrossRef]
[85] Taloma, R.J.L.; Cuomo, F.; Comminiello, D.; Pisani, P. Machine Learning for Smart Water Distribution Systems: Exploring Applications, Challenges and Future Perspectives. Artif. Intell. Rev. 2025, 58, 120. [CrossRef]
[86] Volk, J. Assessing the Accuracy of OpenET Satellite-Based Evapotranspiration Data to Support Water Resource and Land Management Applications; Cassyni: London, UK, 2024. [CrossRef]
[87] Falkenmark, M.; Lannerstad, M. Consumptive Water Use to Feed Humanity—Curing a Blind Spot. Hydrol. Earth Syst. Sci. 2005, 9, 15–28. [CrossRef]
[88] Rost, S.; Gerten, D.; Bondeau, A.; Lucht, W.; Rohwer, J.; Schaphoff, S. Agricultural Green and Blue Water Consumption and Its Influence on the Global Water System. Water Resour. Res. 2008, 44, 9. [CrossRef]
[89] Boulay, A.M.; Bulle, C.; Bayart, J.B.; Deschênes, L.; Margni, M. Regional Characterization of Freshwater Use in LCA: Modeling Direct Impacts on Human Health. Environ. Sci. Technol. 2011, 45, 8948–8957. [CrossRef] [PubMed]
[90] Zhang, Z.; Yang, H.; Shi, M. Analyses of Water Footprint of Beijing in an Interregional Input–Output Framework. Ecol. Econ. 2011, 70, 2494–2502. [CrossRef]
[91] Boulay, A.M.; Hoekstra, A.Y.; Vionnet, S. Complementarities of Water-Focused Life Cycle Assessment and Water Footprint Assessment. Environ. Sci. Technol. 2013, 47, 11926–11927. [CrossRef]
[92] Liu, J.; Yang, H.; Gosling, S.N.; Kummu, M.; Flörke, M.; Pfister, S.; Hanasaki, N.; Wada, Y.; Zhang, X.; Zheng, C.; et al. Water Scarcity Assessments in the Past, Present, and Future. Earth’s Future 2017, 5, 545–559. [CrossRef]
[93] Miglietta, P.P.; De Leo, F.; Toma, P. Environmental Kuznets Curve and the Water Footprint: An Empirical Analysis. Water Environ. J. 2016, 31, 20–30. [CrossRef]
[94] Vanham, D.; Medarac, H.; Schyns, J.F.; Hogeboom, R.J.; Magagna, D. The Consumptive Water Footprint of the European Union Energy Sector. Environ. Res. Lett. 2019, 14, 104016. [CrossRef]
[95] Jamshidi, S. Grey Water Footprint Accounting, Challenges, and Problem-Solving; Springer: Singapore, 2020. [CrossRef]
[96] Weerasooriya, R.R.; Liyanage, L.P.K.; Rathnappriya, R.H.K.; Bandara, W.B.M.A.C.; Perera, T.A.N.T.; Gunarathna, M.H.J.P.; Jayasinghe, G.Y. Industrial Water Conservation by Water Footprint and Sustainable Development Goals: A Review. Environ. Dev. Sustain. 2021, 23, 12661–12709. [CrossRef]
[97] Hirwa, H.; Peng, Y.; Zhang, Q.; Qiao, Y.; Leng, P.; Tian, C.; Yang, G.; Muhirwa, F.; Diop, S.; Kayiranga, A.; et al. Sustainable Virtual Water Transfers: A Comparative Assessment of the Topical Condition of Water Scarcity and Water Savings in Africa. ESS Open Archive 2021 preprint. [CrossRef]
[98] Mehla, M.K. Regional Water Footprint Assessment for a Semi-Arid Basin in India. PeerJ 2022, 10, e14207. [CrossRef] [PubMed]
[99] Verma, N.; Talwar, P.; Upadhyay, A.; Singh, R.; Lindenberger, C.; Pareek, N.; Sarangi, P.K.; Zorpas, A.A.; Vivekanand, V. Food-Energy-Water Nexus in Compliance with Sustainable Development Goals for Integrating and Managing the Core Environmental Verticals for Sustainable Energy and Circular Economy. Sci. Total Environ. 2024, 930, 172649. [CrossRef]
[100] Mperejekumana, P.; Shen, L.; Zhong, S.; Muhirwa, F.; Gaballah, M.S.; Nsigayehe, J.M.V. Integrating Climate Change Adaptation into Water-Energy-Food-Environment Nexus for Sustainable Development in East African Community. J. Clean. Prod. 2024, 434, 140026. [CrossRef]
[101] Zahedi, R.; Yousefi, H.; Aslani, A.; Ahmadi, R. Water, Energy, Food and Environment Nexus (WEFEN): Sustainable Transition, Gaps and Covering Approaches. Energy Strateg. Rev. 2024, 54, 101496. [CrossRef]
[102] Song, S.; Fang, L.; Yang, J.; Zhou, R.; Bai, G.; Qiu, Y. The Spatial-Temporal Matching Characteristics of Water Resources and Socio-Economic Development Factors: A Case Study of Guangdong Province. Water 2024, 16, 362. [CrossRef]
[103] Cutlac, I.M.; He, L.; Horbulyk, T.M. Integrated Modelling for River Basin Management: The Influence of Temporal and Spatial Scale in Economic Models of Water Allocation. Water Sci. Technol. 2006, 53, 55–63. [CrossRef]
[104] Wang, Y.; Jiang, Z.; Zhang, L. Sponge City Policy and Sustainable City Development: The Case of Shenzhen. Front. Environ. Sci. 2022, 9, 772490. [CrossRef]
[105] Kashyap, D.; Agarwal, T. Carbon Footprint and Water Footprint of Rice and Wheat Production in Punjab, India. Agric. Syst. 2021, 186, 102959. [CrossRef]
[106] Mekonnen, M.M.; Hoekstra, A.Y. Sustainability of the Blue Water Footprint of Crops. Adv. Water Resour. 2020, 143, 103679. [CrossRef]
[107] Quinteiro, P.; Ridoutt, B.G.; Arroja, L.; Dias, A.C. Identification of Methodological Challenges Remaining in the Assessment of a Water Scarcity Footprint: A Review. Int. J. Life Cycle Assess. 2017, 23, 164–180. [CrossRef]
[108] Muratoglu, A.; Iraz, E.; Ercin, E. Water Resources Management of Large Hydrological Basins in Semi-Arid Regions: Spatial and Temporal Variability of Water Footprint of the Upper Euphrates River Basin. Sci. Total Environ. 2022, 846, 157396. [CrossRef]
[109] Guo, D.; Thomas, J.; Lazaro, A.B.; Mahundo, C.; Lwetoijera, D.; Mrimi, E.; Matwewe, F.; Johnson, F. Understanding the Impacts of Short-Term Climate Variability on Drinking Water Source Quality: Observations From Three Distinct Climatic Regions in Tanzania. GeoHealth 2019, 3, 84–103. [CrossRef]
[110] Daghagh Yazd, S.; Wheeler, S.A.; Zuo, A. Understanding the Impacts of Water Scarcity and Socio-Economic Demographics on Farmer Mental Health in the Murray-Darling Basin. Ecol. Econ. 2020, 169, 106564. [CrossRef]
[111] Hammad, A.T.; Falchetta, G. The Long-Run Welfare Impact of Hydrological Extremes in Sub-Saharan Africa; California Digital Library (CDL): Oakland, CA, USA, 2022. [CrossRef]
[112] Suastegui Cruz, S. Estrategias para la seguridad hídrica ante los cambios de precipitación por efectos del cambio climático. RIDE Rev. Iberoam. Para Investig. Y Desarro. Educ. 2021, 12, 23. [CrossRef]
[113] Wang, Y.; Su, Z.; Zhang, Q. A Study on Spatial-Temporal Differentiation and Influencing Factors of Agricultural Water Footprint in the Main Grain-Producing Areas in China. Processes 2022, 10, 2105. [CrossRef]
[114] Mao, Y.; Liu, Y.; Zhuo, L.; Wang, W.; Li, M.; Feng, B.; Wu, P. Quantitative Evaluation of Spatial Scale Effects on Regional Water Footprint in Crop Production. Resour. Conserv. Recycl. 2021, 173, 105709. [CrossRef]
[115] Zhuo, L.; Gao, J.; Wang, W.; Liu, Y.; Wu, P. Drivers of Water Footprints in Crop Production across Different Temporal and Spatial Scales; Copernicus GmbH: Göttingen, Germany, 2022. [CrossRef]
[116] Montesinos, P.; Camacho, E.; Campos, B.; Rodríguez-Díaz, J.A. Analysis of Virtual Irrigation Water. Application to Water Resources Management in a Mediterranean River Basin. Water Resour. Manag. 2011, 25, 1635–1651. [CrossRef]
[117] Nagypál, V.; Mikó, E.; Czupy, I.; Hodúr, C. Water Footprint. Analecta Tech. Szeged. 2019, 13, 12–20. [CrossRef]
[118] Yalew, S.; Prasad, P.; Mul, M.; van der Zaag, P. Integrating Equity and Justice Principles in Water Resources Modeling and Management. Environ. Res. Lett. 2024, 19, 111001. [CrossRef]
[119] Mercante, C.T.J.; Moraes, M.D.A.B.; Osti, J.A.S. The Global Water Crisis: Be the Change You Want to See in the World; Seven Editora: New York, NY, USA, 2024. [CrossRef]
[120] Zhao, J. The Cubic Water Kuznets Curve: Patterns of Urban Water Consumption and Water Policy Effects. Water Policy 2016, 19, 28–45. [CrossRef]
[121] Sun, S. Water Footprints in Beijing, Tianjin and Hebei: A Perspective from Comparisons between Urban and Rural Consumptions in Different Regions. Sci. Total Environ. 2019, 647, 507–515. [CrossRef]
[122] Conway, P.; Janod, V.; Nicoletti, G. Product Market Regulation in OECD Countries: 1998 to 2003. Available online: https://economix.fr/uploads/source/doc/colloques/2006_droit/Conway-Nicoletti_2.pdf (accessed on 11 December 2025).
[123] Yalew, S.G.; Kwakkel, J.; Doorn, N. Distributive Justice in Water Resources Allocation and Management; Copernicus GmbH: Göttingen, Germany, 2020. [CrossRef]
[124] Yang, G.; Giuliani, M.; Castelletti, A. Operationalizing Equity in Multipurpose Water Systems. Hydrol. Earth Syst. Sci. 2023, 27, 69–81. [CrossRef]
[125] Yu, H.; Yu, S.; He, D.; Lu, Y. Equity Analysis of Chinese Physician Allocation Based on Gini Coefficient and Theil Index. BMC Health Serv. Res. 2021, 21, 455. [CrossRef] [PubMed]
[126] Nie, Y.; Avraamidou, S.; Xiao, X.; Pistikopoulos, E.N.; Li, J.; Zeng, Y.; Song, F.; Yu, J.; Zhu, M. A Food-Energy-Water Nexus Approach for Land Use Optimization. Sci. Total Environ. 2019, 659, 7–19. [CrossRef] [PubMed]
[127] Miralles-Wilhelm, F. Development and Application of Integrative Modeling Tools in Support of Food-Energy-Water Nexus Planning—A Research Agenda. J. Environ. Stud. Sci. 2016, 6, 3–10. [CrossRef]
[128] Han, D.; Yu, D.; Cao, Q. Assessment on the Features of Coupling Interaction of the Food-Energy-Water Nexus in China. J. Clean. Prod. 2020, 249, 119379. [CrossRef]
[129] Farmandeh, E.; Choobchian, S.; Karami, S. Conducting Water-Energy-Food Nexus Studies: What, Why, and How. Sci. Rep. 2024, 14, 27310. [CrossRef]
[130] Tabatabaie, S.M.H.; Murthy, G.S. Development of an input-output model for food-energy-water nexus in the pacific northwest, USA. Resour. Conserv. Recycl. 2021, 168, 105267. [CrossRef]
[131] Okola, I.; Omullo, E.O.; Ochieng, D.O.; Ouma, G. A Multiobjective Optimisation Approach for Sustainable Resource Consumption and Production in Food-Energy-Water Nexus. In Proceedings of the 2019 IEEE AFRICON, Accra, Ghana, 25–27 September 2019; IEEE: New York, NY, USA, 2019. [CrossRef]
[132] Sambo, B.; Cocuccioni, S.; Carnelli, F.; Sperotto, A.; Terzi, S.; Torresan, S.; Pittore, M.; Critto, A. Stakeholders’ Engagement for the Identification of Measures Supporting Ecosystem Services within the Water-Energy-Food-Ecosystems (WEFE) Nexus in the Adige River Basin (Italy); Copernicus GmbH: Göttingen, Germany, 2025. [CrossRef]
[133] Galli, A.; Wiedmann, T.; Ercin, E.; Knoblauch, D.; Ewing, B.; Giljum, S. Integrating Ecological, Carbon and Water Footprint into a ‘Footprint Family’ of Indicators: Definition and Role in Tracking Human Pressure on the Planet. Ecol. Indic. 2012, 16, 100–112. [CrossRef]
[134] Čuček, L.; Klemeš, J.J.; Kravanja, Z. A Review of Footprint Analysis Tools for Monitoring Impacts on Sustainability. J. Clean. Prod. 2012, 34, 9–20. [CrossRef]
Disclaimer/Publisher’s Note: The views expressed in this article are those of the author(s) and do not necessarily reflect the views of the publisher or editors. The publisher and editors assume no responsibility for any injury or damage resulting from the use of information contained herein.
©2025 Copyright by the Authors.
Licensed as an open-access article distributed under the terms and conditions of the CC BY 4.0 license
We use cookies to improve your experience on our site. By continuing to use our site, you accept our use of cookies. Learn more