 ACCESS
Research Article
ACCESS
Research Article
Volume 1, Article ID: 2025.0020

Muhammad Nadeem
nadeemjarral460@gmail.com


Bhagat Suberi
Bsuberi.cnr@rub.edu.bt


Mujahid Farid
mujahid.farid@uog.edu.pk

1 College of Natural Resources, Lobesa, Punakha Royal University of Bhutan, Bhutan
2 Department of Environmental Science, University of Gujrat, Hafiz Hayat Campus, Gujrat, 50700, Pakistan
* Author to whom correspondence should be addressed
Received: 30 Jun 2025 Accepted: 14 Nov 2025 Available Online: 17 Nov 2025
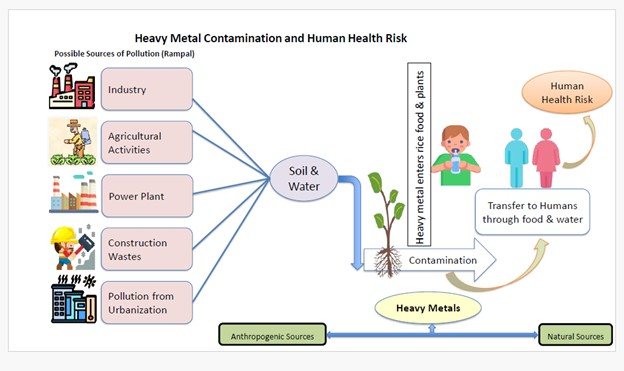
This study was conducted to assess the risk of heavy metal contamination in soil from the sample collection areas. The study aimed to determine whether soil properties such as electrical conductivity (EC), pH, and organic matter (OM) affect heavy metal concentrations in soil. Composite soil samples were collected and analyzed using Atomic Absorption Spectroscopy (AAS) for heavy metal concentrations at a depth of 0-15 cm following the order of Zn > Pb > Cd > Cu. In addition, human health risk assessments with Average Daily Dose (ADD), Hazard Index (HI), Total Hazard Quotient (THQ), and Carcinogenic Risk Assessment (CRA) were conducted for adults and children using dermal ingestion and inhalation paths. The results showed no significant correlation between heavy metal concentrations and soil physicochemical properties. Although Zn and Cu (r = 0.62, p < 0.01) and Cu and Pb (r = 0.57, p < 0.01) showed a moderately positive relation, representing common contamination sources probably from industrial actions and vehicular emissions. In addition, Zinc exhibited a low negative correlation with pH (r = -0.28, p < 0.01), signifying reduced metal availability in alkaline soils. However, the health risk assessment revealed that children in urban areas face higher contamination risks, with a Hazard Index (HI) of 0.06, compared to 0.01 in rural children. Carcinogenic risk assessment revealed that lead (Pb) and Cadmium (Cd) pose the highest risks, with cumulative risk for urban children (CR = 1.99 × 10⁻⁴) reaching the upper threshold of the acceptable range. These results emphasize the urgent need for pollution control measures in urban environments. Future studies could explore specific contamination pathways and remediation strategies to minimize human health risks. This study contributes to sustainability by identifying soil contamination risks and providing baseline data for safer land use planning. Findings support sustainable agricultural practices and informed policy decisions to protect ecosystems and human health.
Disclaimer : This is not the final version of the article. Changes may occur when the manuscript is published in its final format.