 ACCESS
Research Article
ACCESS
Research Article
Volume 1, Article ID: 2024.0005

Shivam Bhutiani
shivambhutiani.py@gmail.com

Nupur Shah
1 Independent Researcher, Lucknow 226025, Uttar Pradesh, India
2 Independent Researcher, Ottawa, ON K1S5G5, Canada
* Author to whom correspondence should be addressed
Received: 22 Nov 2024 Accepted: 10 Jan 2025 Available Online: 11 Jan 2025 Published: 10 Mar 2025
The rapid surge in the technological advancement of humanity calls for development of faster, reliable & effective communication methods between satellites orbiting in outer space. The infamous inter-satellite link technology, coupled with free space optical communication is a robust solution for the same. While establishing this for low earth orbit satellites, it is critical to ensure that the links established across the two satellites avoid the atmosphere, i.e., the links stay above the Kármán Line. This becomes necessary as optical beams suffer a lot of attenuation due to atmosphere. This research aims to calculate the maximum possible perpendicular range at which two low earth orbit satellites can be offset, while avoiding the atmospheric interference in the links. By using simple Pythagorean mathematics and spacecraft simulations, the results provide a promising solution for the placement of satellites in low earth orbits. Along-with the maximum range determination, a comprehensive power analysis is conducted theoretically using MATLAB and then the same is simulated in OptiSystem software. The power analysis provides insights that are crucial for determining optical receiver sensitivity, link budget and data rates supported by the link. Both range and power analysis is performed for multiple circular low earth orbits ranging from 400 km to 1200 km with a 100 km step size. The results demonstrate a lowest maximum range value of 4511.6 km & the highest received power value of −48.69 dBm for the 400 km orbit and the highest maximum range value of 14,075 km & the lowest received power value of −58.57 dBm for the 1200 km orbit. A high data-rate of 2.5 Gb/s is obtained between the satellites in the 400 km orbit with an acceptable bit-error ratio value of 4.17 × 10⁻⁸.
Over the last two decades, there has been an overwhelming rise in research and development in the field of optical communication, particularly in the domain of free space optical communication (FSOC). Instead of relying on physical cables like optical fibers, FSOC transmits data through air or space using light as a frequency carrier. This technology has become increasingly popular across the entire space and electronics sector due to its various advantages over conventional fiber-based or RF-based (radio-frequency) communication systems. FSOC provides higher data rates and larger bandwidth due to its high carrier frequency (around 193 THz). It also offers improved power efficiency, as optical beams require significantly less power compared to traditional RF antenna systems. Additionally, it ensures minimal latency since this form of communication operates in a direct line of sight without bouncing off surfaces. Secure transmission is another advantage, enabled by the narrow beamwidths and high directivity of optical telescopes. Interestingly, the space sector has made the most use of the FSOC technology by implementing the same for ground to satellite and inter-satellite link (ISL) communication applications. ISLs remove the need of ground station as facilitator for communication between two satellites, thereby enabling direct line of sight communication between them. NASA achieved FSOC between a lunar satellite and a ground station at a distance of 400,000 km in their LLCD (Lunar Laser Communications Demonstration) experiment. This experiment achieved an uplink data rate of 20 Mbps and a downlink data rate of 622 Mbps between the ground station and the lunar spacecraft [1]. In 2014, the Optical Payload for Lasercomm Science (OPALS) was installed in the International Space Station (ISS) with an aim to establish secure and speedy FSOC links with spacecraft in Low Earth Orbits (LEOs) under NASA [2]. In 2019, ISRO did the same but they established a ground to satellite optical link between an optical ground station and a geostationary orbit satellite (GEO) in their GSAT-29 mission [3]. A duplex ISL scheme was proposed by ESA to achieve optical ISL data speeds up to 50 Mb/s in LEO and GEO in the SILEX program that comprises two FSOC payloads namely SPOT-4 & PASTEL [4]. A LEO to GEO ISL FSOC scheme & simulation shows enhanced data rates that are way better than RF along-with a much lower power input, better link margin and better reliability [5]. Optical beams are widely known to experience significant attenuation due to atmospheric turbulence, cloud cover, and effects such as scattering, dispersion, and beam wandering. A primary focus is needed to counter the challenges faced in establishing reliable and high-speed communication links through the atmosphere. In [6,7,8] a comprehensive examination of the obstacles faced in free space optical communication has been done and the strategies employed to mitigate these challenges effectively have been discussed. Satellites in LEO are essential for tasks like Earth observation and telecommunications. Connecting these LEO satellites through reliable ISLs facilitates faster data transfer, real-time data processing, and better satellite management. Now, few questions arise that eventually made this research happen. Can we completely avoid this atmosphere that is causing so much attenuation? Can we deploy such an ISL scheme for LEO satellites that the link completely avoids the atmosphere and connects to the other LEO satellite? If yes, then what is the maximum range these LEO satellites can be offset from each other that the link completely avoids the atmosphere, that is, it stays above the Kármán Line? Kármán Line is a theoretical boundary (approximately 100 km above earth’s surface) that separates the main chunk of the atmosphere from outer space. This does not mean that the part above the Kármán Line is completely vacuum, but the atmosphere there is so thin that it has really negligible effects of atmospheric attenuation on optical communication beams. Ref. [9] explores the historical context, scientific rationale, and contemporary perspectives surrounding the definition and relevance of the Kármán Line. Ref. [10] indicates a novel approach to addressing the challenges associated with defining the Kármán line, aiming to contribute to the advancement of knowledge and understanding regarding Earth’s atmosphere and its boundaries in the context of space exploration. To the best of available knowledge, determination of the maximum possible distance at which LEO satellites can be given an offset in a LEO constellation while avoiding the atmosphere has not been yet done by anyone. This can prove to be crucial in future for researchers of this field, as satellite offset distance data directly provides the base of determining the total number of satellites that can be accommodated in that specific orbit. A data-rate and wavelength comparison has been done between existing systems and this work in Table 1.
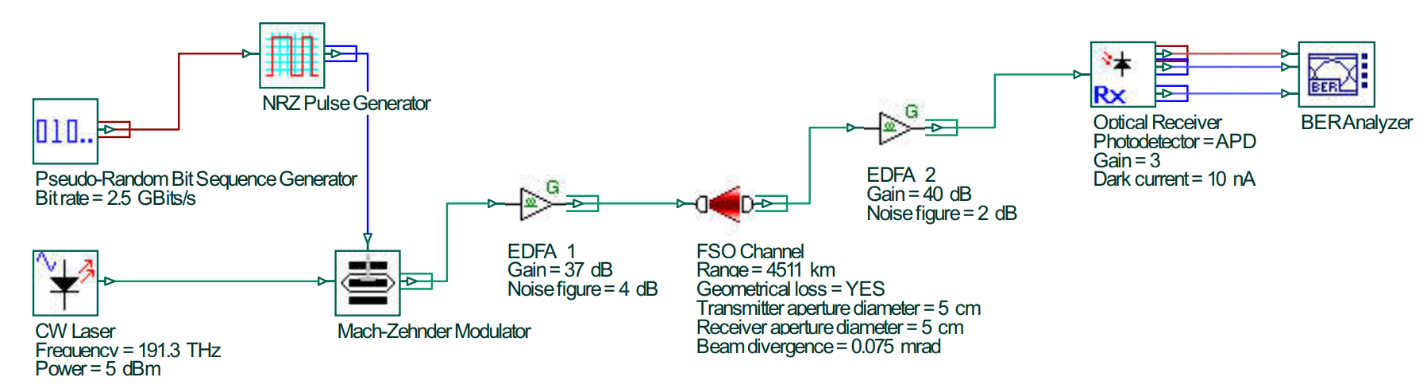
As discussed earlier in the Introduction section, this study aims to calculate the maximum possible distance between two LEO satellites while avoiding a major chunk of atmosphere that dominantly occurs below the Kármán Line. The methodology involves two satellites with FSOC payloads, S1 and S2, in a LEO orbit, a reference ground station and the Kármán Line at 100 km altitude. Let’s say, the first scenario is for a circular orbit of 500 km with 0 degrees inclination. GMAT will give the slant range of S1 from the reference ground station. This range data is very important for the Pythagorean calculation which will eventually provide the half-range between the satellites S1 and S2 above the Kármán Line. The Kármán Line height, defined as 100 km above the Earth’s surface, is utilized, and the Pythagorean theorem is applied to calculate the desired range values. The entire Pythagorean setup can be envisioned in Figure 1. A ground station, along with satellites S1 and S2 in a 500 km orbit, is depicted, while the dotted line around the Earth represents the Kármán Line, located 100 km above ground level. The point A is the center point of the line-of-sight distance between S1 and S2. It is also the point that just touches the Kármán Line, which means that the line joining S1 and S2 via point A will the maximum possible distance for an optical link between them while avoiding a major chunk of the atmosphere. Determination of received optical power is crucial for determination of the data rate that the link can support, for intricate details that are needed before hand while designing optical receivers, telescopes, etc. [11,12] focus on the crucial aspect of estimating the link budget for free-space optical communications, which is essential for designing reliable and efficient communication systems in space environments. Therefore, using well-established optical communication formulas & simulation software, an optical received power analysis was conducted, considering attenuation factors such as free space path loss, telescope efficiencies, fiber-coupling losses, pointing losses, and system losses. This received power analysis has been done for all circular orbits in the range of 400 km to 1200 km. All the calculations and post-processing of the data has been done in MATLAB and the satellites, the ground station (GS) and their range data has been simulated and obtained from NASA General Mission Analysis tool (GMAT). After theoretical estimation and power calculation, all LEO-to-LEO scenarios are simulated in OptiSystem software for determination of highest possible data rates, bit-error ratio (BER), and Quality factor (Q-factor), based on the eye diagrams obtained from the simulations. BER is basically the ratio of the received error bits upon the total number of bits transmitted. BER and Q-factor are two co-related parameters that are usually used to determine received signal’s quality and ultimately, system performance. In simpler words, wider the eye, the higher is the Q-factor value and lower is the BER value which ultimately means better system performance. 2.1. GMAT Simulation GMAT simulates the satellites in the required orbits one by one ranging from 400 km to 1200 km with 0 degrees inclination angle. It also simulates a reference ground station. By generating slant range reports, it allows us to determine the maximum slant range of satellite S1 from the ground station, precisely when the satellite crosses the horizon and comes into the line of sight of the ground station. This simulation provides us a very crucial parameter that is the maximum slant range of the satellite from a ground station on earth. 2.2. Pythagorean Calculation As depicted in Figure 1, we can perform basic Pythagorean mathematics on the diagram and find out the distance between S1 and S2. GMAT gives the distance value between S1 and reference ground station. We know that the perpendicular distance of point A directly above the ground station is 100 km. We can deploy Pythagoras theorem and calculate the distance between point A and S1. Doubling the distance between point A and S1 gives us the total distance between S1 and S2. This keeps on iterating for all orbits ranging from 400 km to 1200 km with a 100 km step size. 2.3. LEO S1 & S2 Optical Payload The LEO satellites S1 & S2 carry optical payloads to establish FSOC links between each other. In this subsection the optical telescope parameters, transmit power, telescope efficiencies, fiber coupling losses, system losses, pointing losses & operating wavelength have been discussed. The same have been tabulated in Table 2 for both transmitter (Tx) and receiver (Rx) sides respectively. Transmitter and Receiver payload parameters. The optical aperture for both Tx and Rx telescopes is 5 cm as both payloads have to be made small in size, to make them lightweight & feasible for installation on low-power LEO satellites. A 5-watt (37 dBm) optical transmit beam is fired through free space, as it saves both power consumption and carries enough photons that can be detected at the receiver-end easily. The efficiencies of both the telescopes have been assumed as 50% to leave ample amount of power loss window to consider lens losses like absorption, aberration, etc. within the telescopes. The pointing losses, system implementation losses, and fiber coupling losses were predetermined and calibrated physically in an optical communication systems lab at the Indian Space Research Organization [5], which is also part of previous research on FSOC. The operating carrier wavelength has been chosen as 1550 nm. It is a well-known fact, also mentioned by various authors in multiple papers that this wavelength suffers minimum losses in optical fibers, as low as 0.2 dB/km [13]. 2.4. Received Power Analysis Multiple factors affect the power levels received by APDs (Avalanche Photodiodes) or PIN (Positive-Intrinsic-Negative) diodes at the receiving end. These factors include free space path loss, pointing losses, coupling loss, implementation loss, efficiency loss and atmospheric attenuation due to turbulence, light scattering, dispersion, beam wandering, etc. Atmospheric attenuation is not considered in this research, as the focus is specifically on working outside the atmosphere, above the Kármán Line. Free space path loss is a key concept of electromagnetic (EM) wave theory, which states that any EM wave travelling through a medium or vacuum faces attenuation and power decrease as it travels further and further through space. This path loss can be calculated using the fspl function in MATLAB. Pointing losses are considered to account for losses incurred due to improper alignment of incoming beam into the telescopes These losses occur as the azimuth and elevation angles continuously change every second, owing to the constant motion of both satellites. To keep the transmitting and receiving terminals aligned with each other, quad-detectors are used to rotate the gimbals on which the telescopes are mounted. Fiber coupling losses are the losses incurred when the free space beam is coupled from a telescope into an optical fiber and vice versa. Implementation losses are small losses within the system due to factors such as thermal noise, dark current, etc. The pointing losses, implementation losses and coupling losses have already been calibrated using a proper optical test bench setup in an optical communications lab at ISRO, as mentioned before [5]. Efficiency loss accounts for the telescope transmit and receive losses because the telescope obviously does not transmit and receive 100% of the outgoing & input power. Since, the transmitted optical beam is gaussian in nature, the optical system faces geometrical losses as the beam diverges outwards during propagation. This is determined by the divergence of the transmitting telescope and is given by Equation (2) below. Considering the carrier wavelength as 1550 nm and 5 cm as the diameter of the telescope we get a beam divergence of 0.075 milliradians. This value is considered during OptiSystem simulations that adds geometric losses to the system as well. The received power is determined for different ISL scenario with satellite orbits ranging from 400 km to 1200 km. The optical received power is calculated using all standard optical communication formulas while considering all the intricate losses and attenuation faced by the optical link. These are all well-established and verified formulas mentioned in various optical communication books and papers [5,14]. The theoretical received power analysis is done in MATLAB and the formulas used for transmitting, receiving telescope gains, efficiency losses, free space path loss, etc. are given as below. Here, Ptx is transmitter input power, Ltx and Lrx are absolute Tx and Rx telescope efficiency losses respectively, Gtx and Grx are Tx and Rx telescope gains respectively, abs_Gtx & abs_Grx are absolute values of Tx and Rx telescope gains in dB, PLtx and PLrx are pointing losses of both telescopes respectively. IL and CL are the implementation and coupling losses respectively. FSPL is the free space path loss. θ is the beam divergence of the optical beam. λ is the operating wavelength of the light beam. D is the telescope aperture diameter. Different gain calculation formulas are used for the transmitter (Tx) and receiver (Rx) because the wave at the transmitting end is a Gaussian wave, and by the time it reaches the receiver, it becomes equivalent to a planar wave. Then, the same is simulated in OptiSystem software and values are cross-verified. The OptiSystem layout can be envisioned in Figure 2. We use a very low input power (5 dBm) continuous-wave laser supply, a random bit sequence generator with variable data rate values for different orbits (set to 2.5 Gb/s in the figure for 400 km scenario) which is connected to a NRZ pulse generator coupled into a Mach-Zehnder modulator for modulation of the binary data onto the optical carrier beam. The modulated signal then passes through a 37 dB gain optical amplifier and a 4 dB noise figure and then gets transmitted through a free space channel through the 5 cm telescope with a beam divergence value of 0.075 mrad. Geometrical losses are enabled in the simulation and the pre-determined optical losses (discussesed earlier) that amount to a total of 8 dB losses have also been added. The transmitted signal is then captured by the receiving telescope and coupled into an optical fiber that passes through a low-noise amplifier with a 40 dB gain & a noise figure value of 2 dB. It then goes into an optical receiver that has an avalanche photodiode (APD) to detect the incoming signal, a low pass Bessel filer to filter out the unwanted stray wavelengths and a 3R generator to generate a binary sequence, a square NRZ signal and an analog signal which is coupled into a BER analyzer to determine Q-factor and BER values along-with eye-diagrams. A wide-open eye indicates good signal quality along-with high Q-factor values and lower BER values. There are various commercially available optical APD-based receivers with sensitivities going as low as −29 dBm as mentioned in [15]. Commercial optical component companies such as Thorlabs, etc. offer these types of free space receivers. The received signals, amplified by 40 dB optical amplifier can easily be detected by these receivers.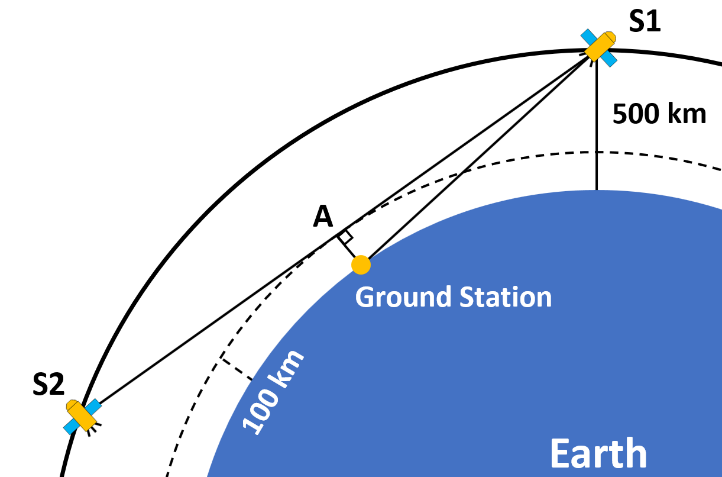
Table 2:
Parameters
Unit
Tx
Rx
Telescope Aperture
cm
5
5
Transmit Power
dBm
37
-
Optical Efficiency
%
50
50
Pointing Loss
dB
1.5
1.5
Implementation Loss
dB
0.5
0.5
Fiber Coupling Loss
dB
2
2
Carrier Wavelength
nm
1550
1550
The results section of this work comprises of two subsections, i.e., Multi-Orbit Range Analysis, that tabulates and plots the maximum satellite range trends across different orbital altitudes & Multi-Orbit Power Analysis that tabulates and plots the received power when the proposed optical payload is used on both the LEO satellites across different orbital altitudes. Maximum data rates, BER and Q-factor values along-with eye diagram are also presented and discussed for two peak orbital scenarios, that are 400 km and 1200 km respectively. 3.1. Multi-Orbit Range Analysis In this subsection, maximum range trends of inter-satellite communication in Low Earth Orbit (LEO) beyond the Kármán Line while varying the orbit altitude from 400 km to 1200 km with an inclination of 0 degrees with a step size of 100 km is determined. The same has been tabulated in Table 3 & the trends are plotted in Figure 3. Maximum ISL range across different orbits. 3.2. Multi-Orbit Power Analysis In this subsection, the calculated received power for orbits ranging from 400 km to 1200 km is tabulated and the trends are graphically represented in Table 4 & Figure 4, respectively. Maximum received power for different orbits. After rigorous simulations in OptiSystem, it is observed that the 400 km orbit ISL with a maximum range of 4511 km can support a data rate of 2.5 Gb/s while maintaining good BER and Q-factor values of 4.17 × 10⁻⁸ & 5.346, respectively. An acceptable eye-diagram is observed and can be envisioned in Figure 5. However, for the 1200 km orbit ISL with a maximum range of 14,075 km, the received power falls significantly due to the huge amount of distance that ultimately reduces the data carrying capacity of this link. A 250 Mb/s data rate link can be established for this scenario while maintaining acceptable BER and Q-factor values of 4.82 × 10⁻⁷ & 4.886, respectively. The eye-diagram for 1200 km orbit scenario can be envisioned in Figure 6.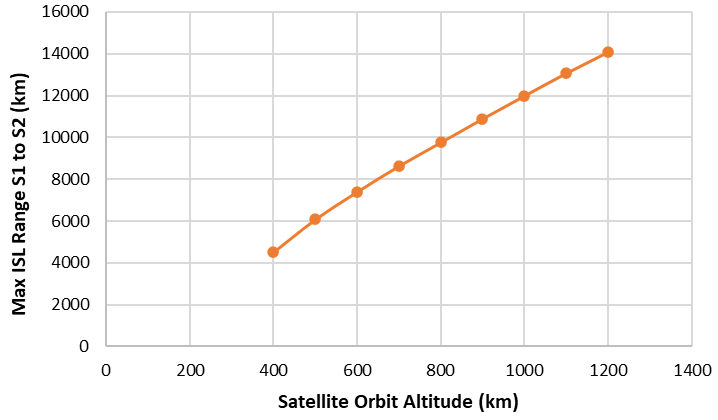 Table 3:
Orbit Altitude (km)
Slant Range from GS (km)
Max ISL Range S1–S2 (km)
400
2291
4511.6
500
3080
6078.3
600
3749
7401.4
700
4372
8631.2
800
4946
9761.7
900
5519
10,890
1000
6077
11,988
1100
6625
13,066
1200
7139
14,075
Table 4:
Orbit Altitude (km)
Max ISL Range S1–S2 (km)
Received Power (dBm)
400
4511.6
−48.69
500
6078.3
−51.28
600
7401.4
−52.99
700
8631.2
−54.33
800
9761.7
−55.4
900
10,890
−56.35
1000
11,988
−57.18
1100
13,066
−57.93
1200
14,075
−58.57
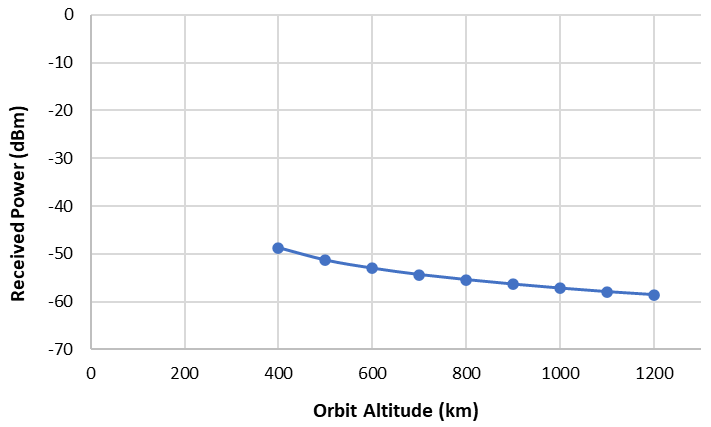
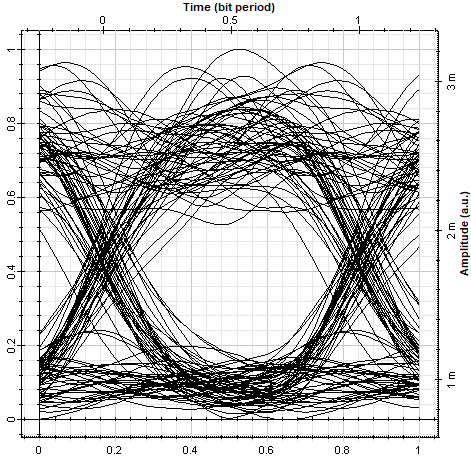
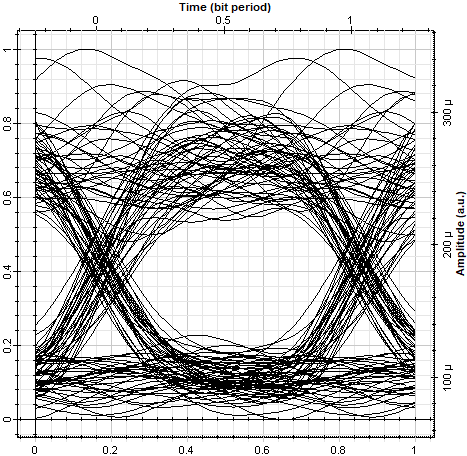
The results of this research work effectively demonstrate the methodology and deliverables in the form of maximum ISL range data between satellites S1 and S2 while avoiding optical beam propagation through atmosphere above the Kármán Line. These results are obtained through simple Pythagorean mathematics, basic simulations in GMAT, calculations in MATLAB, and simulations in OptiSystem software. Earlier a few questions were raised regarding how can FSOC be carried out between two LEO satellites while avoiding hindrance caused by atmosphere. The range results show us the exact maximum perpendicular distance at which satellites in a LEO constellation be offset from each other while avoiding the Kármán Line, effectively answering the earlier raised questions. The same has been done for all primary LEOs ranging from 400 km to 1200 km with minimum perpendicular range being 4511.6 km for 400 km LEO & maximum perpendicular range being 14,075 km for 1200 km LEO. One shortcoming of this range determination is that this works only for circular orbits with 0 degrees inclination. These values are bound to change drastically for differently positioned ground stations, as well as satellites with different orbits and inclination angles. However, this research can be deemed as first of its kind and sets the base and stage for further research with more complex orbits and even more complex mathematical models to determine the maximum perpendicular range above the Kármán Line. Received power is also a very important parameter to determine beforehand, as it is a prerequisite to design optical receivers and also determine link budgets as well as maximum data rates that can be supported by the link. The maximum received power, obviously is obtained in the 400 km LEO, its value being −48.69 dBm. For this received power, a data-rate of 2.5 Gb/s is obtained while maintaining good BER value of 4.17 × 10⁻⁸. It is to be noted that this data rate is achieved by using just a 5-watt (37 dBm) carrier beam. This implies that the system proposed in this research work is very power efficient as it uses only a 5 dBm continuous-wave laser supply and a 37 dB gain optical amplifier and still manages to achieve a data rate of 2.5 Gb/s. The lowest received power is obtained in the highest orbit scenario, i.e., 1200 km LEO, which is −58.57 dBm. This range ISL can support a data rate of 250 Mb/s along-with acceptable BER value of 4.82 × 10⁻⁷. Received power and data rates can be enhanced by increasing the diameter of the telescope, boosting the input optical beam power, using more efficient optical amplifiers with higher gain, or minimizing pointing errors. These improvements can contribute to optical systems that consume more power, leading to enhanced performance. As for this work, the main aim has been to consume as less power as possible since LEO satellites are low duty satellites and low power consuming systems eventually increase the satellite’s mission life. In the end, the entire range and power analysis provides enough data and understanding of the significance of FSOC, the need of FSOC and most importantly the intricate answer to why and how one can establish links while avoiding the atmosphere to minimize losses suffered by the optical ISL. The power analysis also provides a number that is important to be predetermined for purposes like defining receiver sensitivity, link budget and data rates.
The comprehensive analysis conducted in this study sheds light on the range capabilities and received power dynamics of inter-satellite communication in Low Earth Orbit (LEO) beyond the Kármán Line. Investigation into the maximum slant range and distance between LEO satellites in each orbit configuration has highlighted the importance of altitude in determining communication range. It has been observed that higher altitude orbits generally exhibit greater communication range potential with fairly enough amount of received power, emphasizing the significance of optimal orbit selection in space communication system design. Furthermore, the analysis of received power across multiple orbits has provided valuable data on the power levels received by satellites, considering factors such as transmission power, telescope gain, path loss, and potential atmospheric attenuation (that has been entirely removed as the link is established above the Kármán Line). This research work sets the stage for this field of FSOC above the Kármán Line for lot more promising research. Future research could focus on developing improved mathematical models that account for satellites with various inclination angles, as well as ground stations located at different positions on the Earth’s surface.
| FSOC | Free Space Optical Communication |
| RF | Radio Frequency |
| ISL | Inter Satellite Link |
| NASA | National Aeronautics & Space Administration |
| LLCD | Lunar Laser Communications Demonstration |
| OPALS | Optical Payload for Lasercomm Science |
| ISS | International Space Station |
| ESA | European Space Agency |
| ISRO | Indian Space Research Organization |
| LEO | Low Earth Orbit |
| SILEX | Semiconductor Inter Satellite Link Experiment |
| GEO | Geostationary Orbit |
| GMAT | General Mission Analysis Tool |
| Tx | Transmitter |
| Rx | Receiver |
| APD | Avalanche Photodiode |
| PIN | Positive-Intrinsic-Negative |
| EM | Electromagnetic |
| GS | Ground Station |
| NRZ | Non Return to Zero |
Both the authors together identified the problem at hand and conceptualized the base of the research work. SB.: Responsible for GMAT simulations, Pythagorean calculations in MATLAB, OptiSystem simulations and authoring the final manuscript. Also responsible for proofreading and refining the contents of the manuscript. NS.: Responsible for extensive literature survey, received power calculations and plotting of the same in MATLAB and also assisted in writing & proofreading of the final manuscript.
There were no specific datasets used for this research work. The data from the results of this paper is viably mentioned in the results section of this paper itself.
Not applicable.
The work has been carried out independently by both the authors with the main author, Shivam Bhutiani affiliated to IIT (ISM) - Dhanbad, India & co-author, Nupur Shah affiliated to Carleton University, Ottawa, Canada.
No external funding was received for this research.
Both are authors are the sole contributors to this independently carried out research work & the manuscript.
[1] D.M. Boroson, J.J. Scozzafava, D.V. Murphy, B.S. Robinson, M.I.T. Lincoln, "The lunar laser communications demonstration (LLCD)," in Proceedings of the 2009 Third IEEE International Conference on Space Mission Challenges for Information Technology, 19–23 July 2009, Pasadena, CA, USA, pp. 23-28.
[2] M.J. Abrahamson, O. Sindiy, B. Oaida, M. Wilkerson, M. Kokorowski, "OPALS: mission system operations architecture for an optical communications demonstration on the ISS," in Proceedings of the SpaceOps 2014 Conference, 5–9 May 2014, Pasadena, CA, USA, pp. 1627-.
[3] "ISRO" Available online: https://www.isro.gov.in/GSAT_29.html. (accessed on 15 November 2024)
[4] B. Laurent, "SILEX: Overview on the European optical communications programme" Acta Astronaut., vol. 37, pp. 417-423, 1995. [Crossref]
[5] S. Bhutiani, K. Basak, P.K. Pandey, S. Kumar, "Study & Analysis of a Free Space Optical Link Between a Sun Synchronous LEO Satellite and a GEO Satellite," in Proceedings of the 2024 IEEE International Conference on Contemporary Computing and Communications (InC4), 15–16 March 2024, Bangalore, India, pp. 1-4.
[6] H. Kaushal, G. Kaddoum, "Free space optical communication: challenges and mitigation techniques" arXiv, 2015.
[7] J. Mukherjee, B. Ramamurthy, "Communication technologies and architectures for space network and interplanetary internet" IEEE Commun. Surv. Tutor., vol. 15, pp. 881-897, 2012. [Crossref]
[8] A. Trichili, M.A. Cox, B.S. Ooi, M.S. Alouini, "Roadmap to free space optics" JOSA B, vol. 37, pp. A184-A201, 2020. [Crossref]
[9] J.C. McDowell, "The edge of space: Revisiting the Kármán Line" Acta Astronaut., vol. 151, pp. 668-677, 2018. [Crossref]
[10] N. Bérend, "A variant of the Kármán line theory facilitating the identification of a precise altitude boundary," in Proceedings of the International Astronautical congress 2022 (IAC 2022), 18–22 September 2022, Paris, France, pp. -.
[11] J. Liang, A.U. Chaudhry, E. Erdogan, H. Yanikomeroglu, "Link budget analysis for free-space optical satellite networks," in Proceedings of the 2022 IEEE 23rd International Symposium on a World of Wireless, Mobile and Multimedia Networks (WoWMoM), 14–17 June 2022, Belfast, UK, pp. 471-476.
[12] L.B. Stotts, P. Kolodzy, A. Pike, B. Graves, D. Dougherty, J. Douglass, "Free-space optical communications link budget estimation" Appl. Opt., vol. 49, pp. 5333-5343, 2010. [Crossref] [PubMed]
[13] D.Y. Cao, B.H. Liu, Z. Wang, Y.F. Huang, C.F. Li, G.C. Guo, "Multiuser-to-multiuser entanglement distribution based on 1550 nm polarization-entangled photons" Sci. Bull., vol. 60, pp. 1128-1132, 2015. [Crossref]
[14] W.K. Marshall, B.D. Burk, "," in Received Optical Power Calculations for Optical Communications Link Performance Analysis, , Eds. Washington, DC, USA: NASA, 1986, . The telecommunications and data acquisition report
[15] B.F. Levine, J.A. Valdmanis, R.N. Sacks, M. Jazwiecki, J.H. Meier, "-29dBm sensitivity, InAlAs APD-based receiver for 10Gb/s long-haul (LR-2) applications," in Optical Fiber Communication Conference, , Eds. Washington, DC, USA: Optica Publishing Group, 2005, .